Geographers from the University of Tartu participated in a global 30-day map challenge, creating thirty maps of Estonia – see what they came up to.
This is a lightly edited version of the article originally published in the University of Tartu blog.
In late 2020, geographers Evelyn Uuemaa, Anto Aasa, Tõnu Oja, Janika Raun, Alexander Kmoch and the UT Mobility Lab of the University of Tartu participated in the #30DayMapChallenge on Twitter.
The global challenge to create maps was initiated by Topi Tjukanov, a Finnish geographic information system professional. In 2020, at least 1,378 people tweeted the hashtag and 797 people made 6,882 maps. Geographers used open data and open-source software to make the maps.
Estonian World publishes 30 selected maps by the University of Tartu geographers, grouped by topic. The maps (click for a larger view) visualise both essential and fun facts about Estonia.
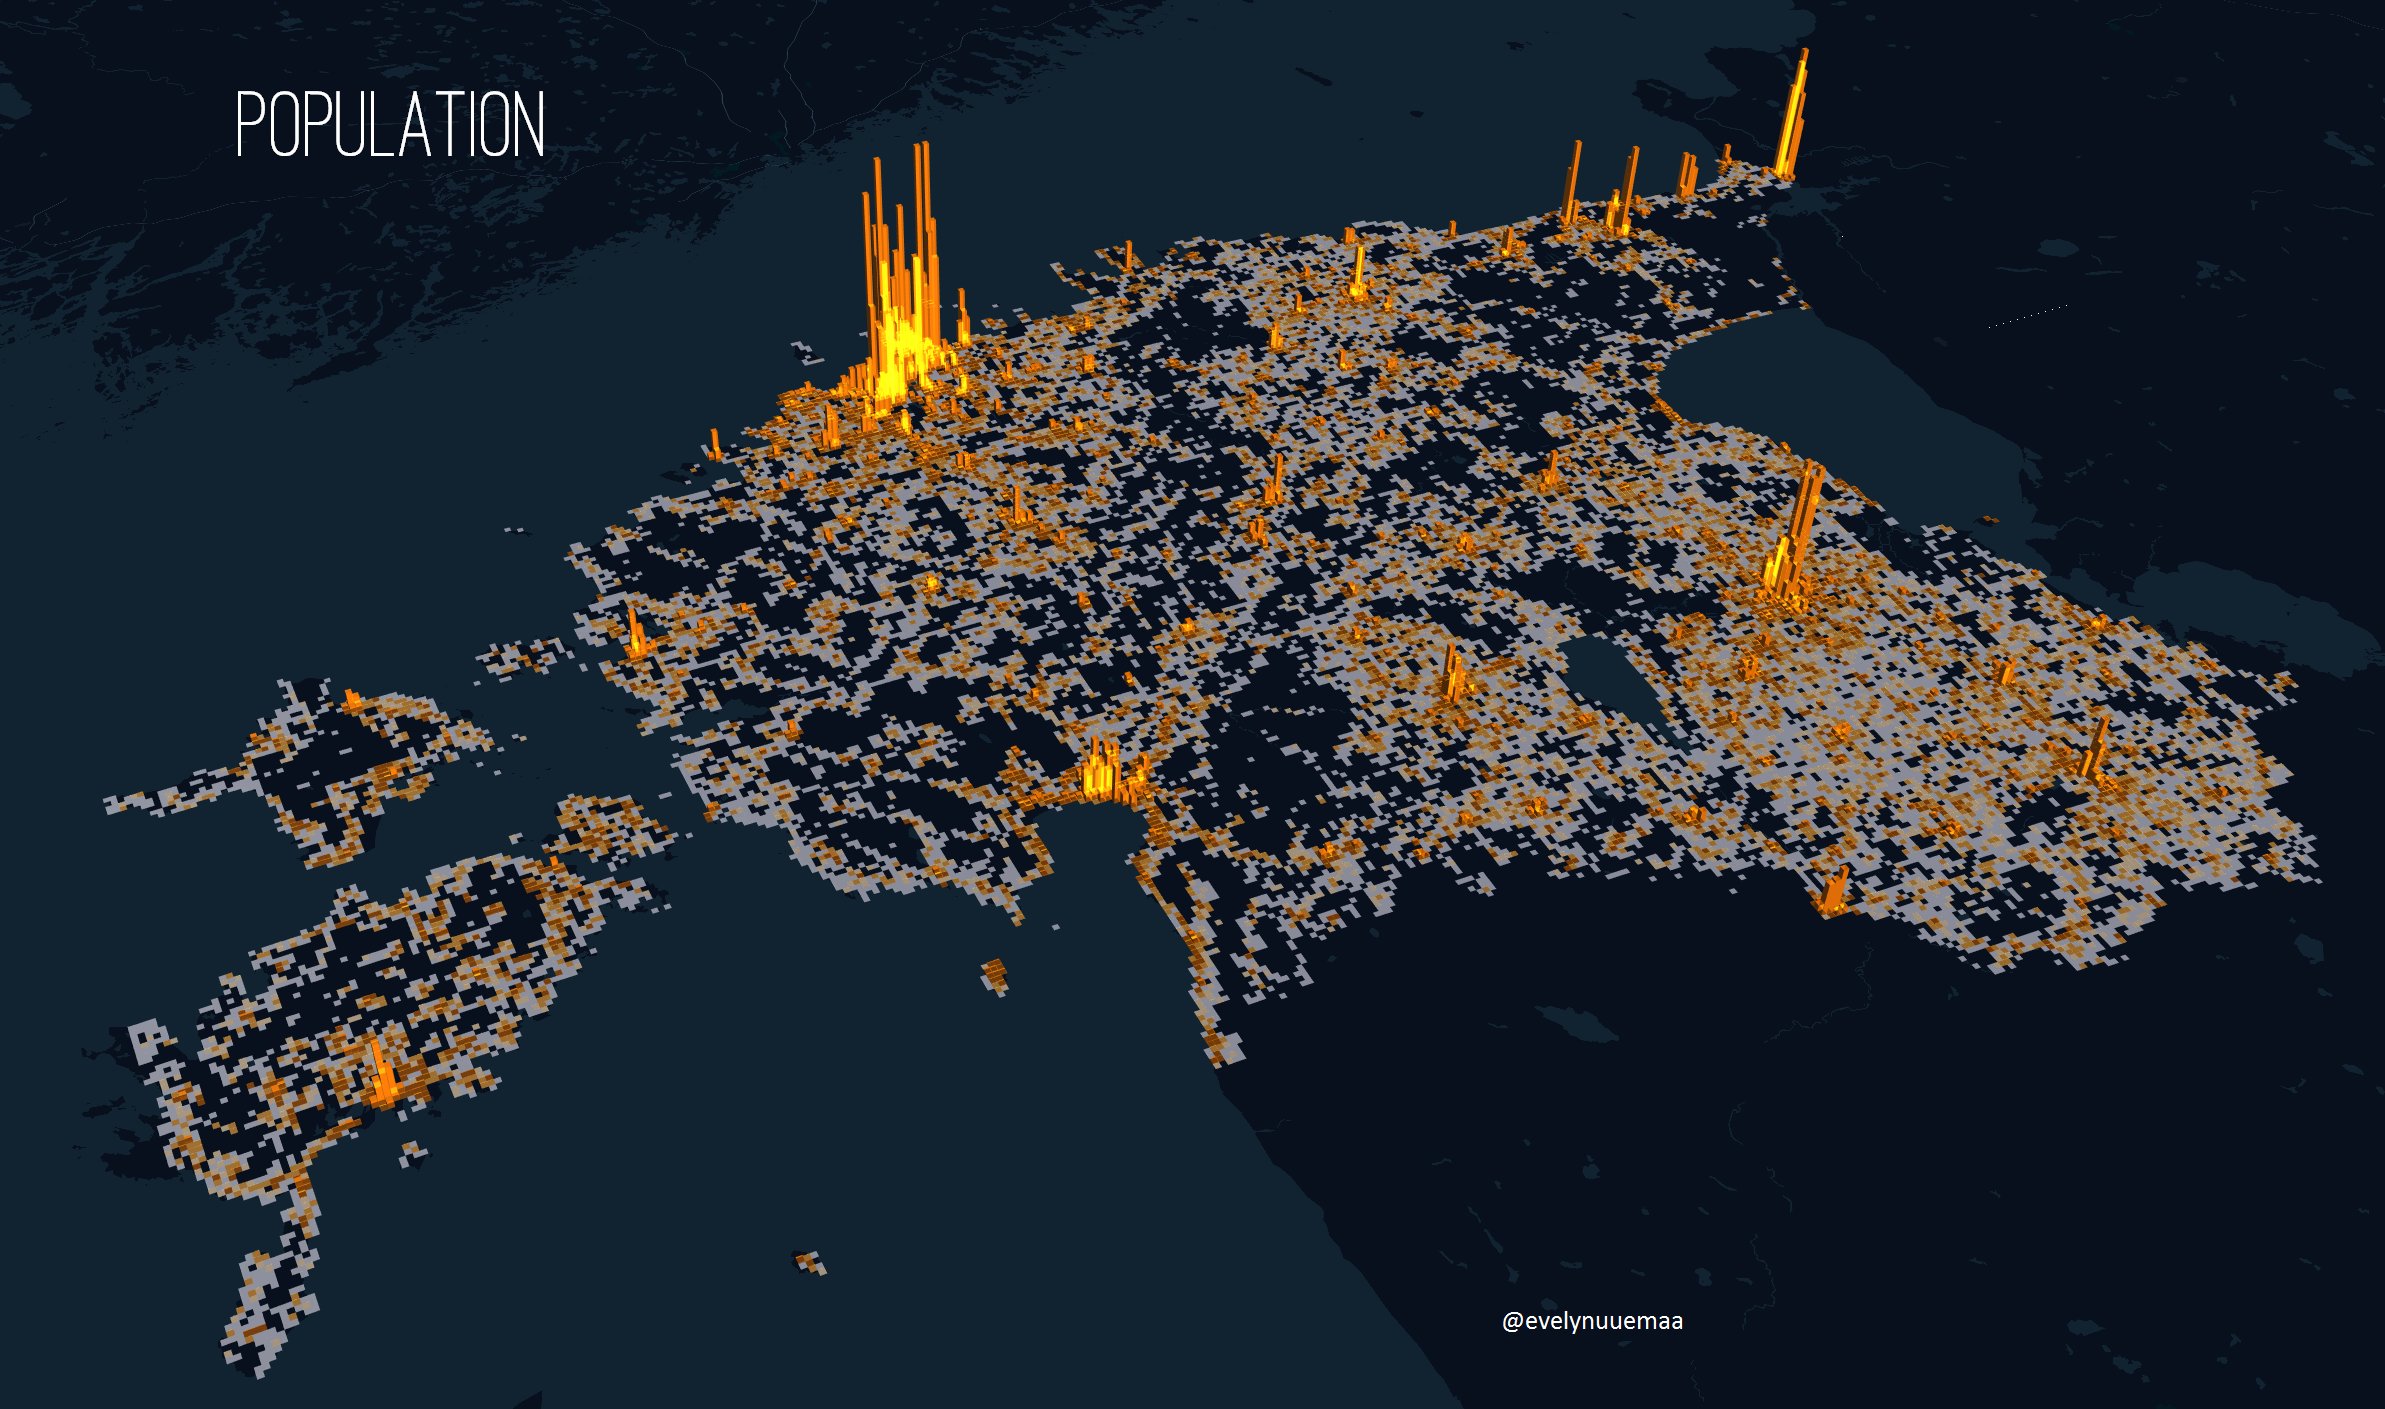
Population map of Estonia
Population in Estonia. Data: Estonian Statistics. Map by Evelyn Uuemaa.
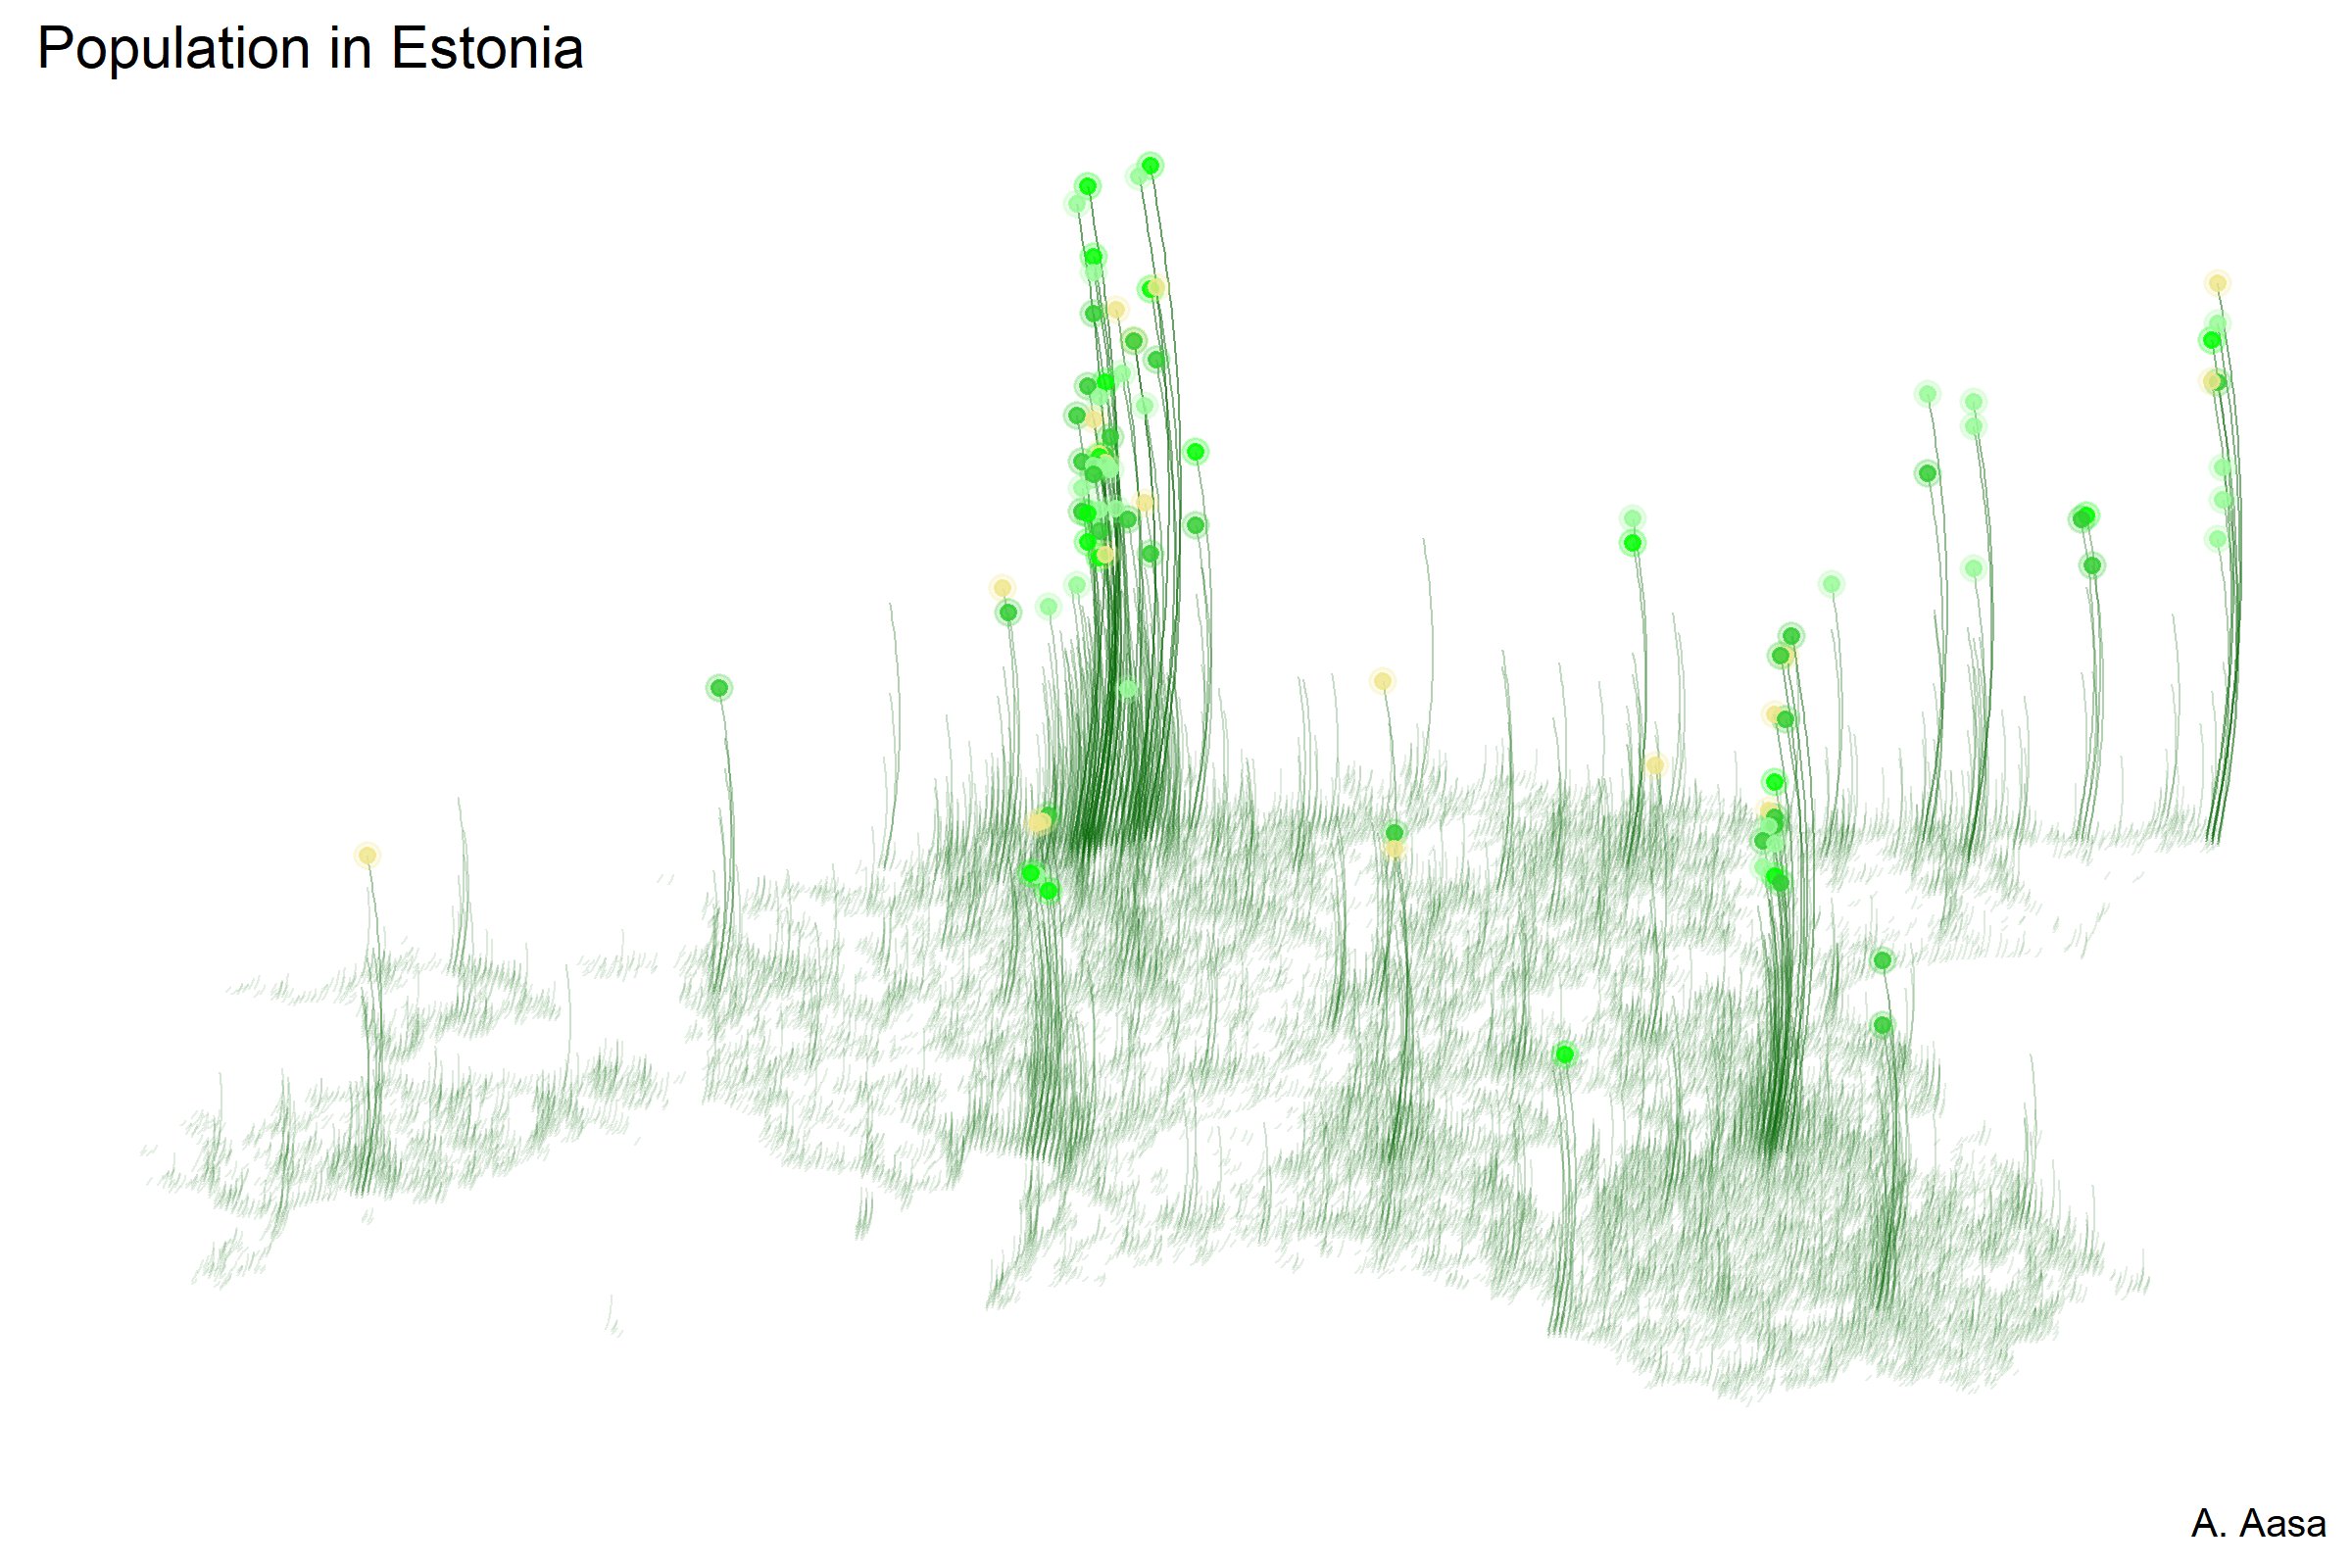
Green population map of Estonia
Let’s repeat the population map in green. Data: Statistics Estonia. Map by Anto Aasa.
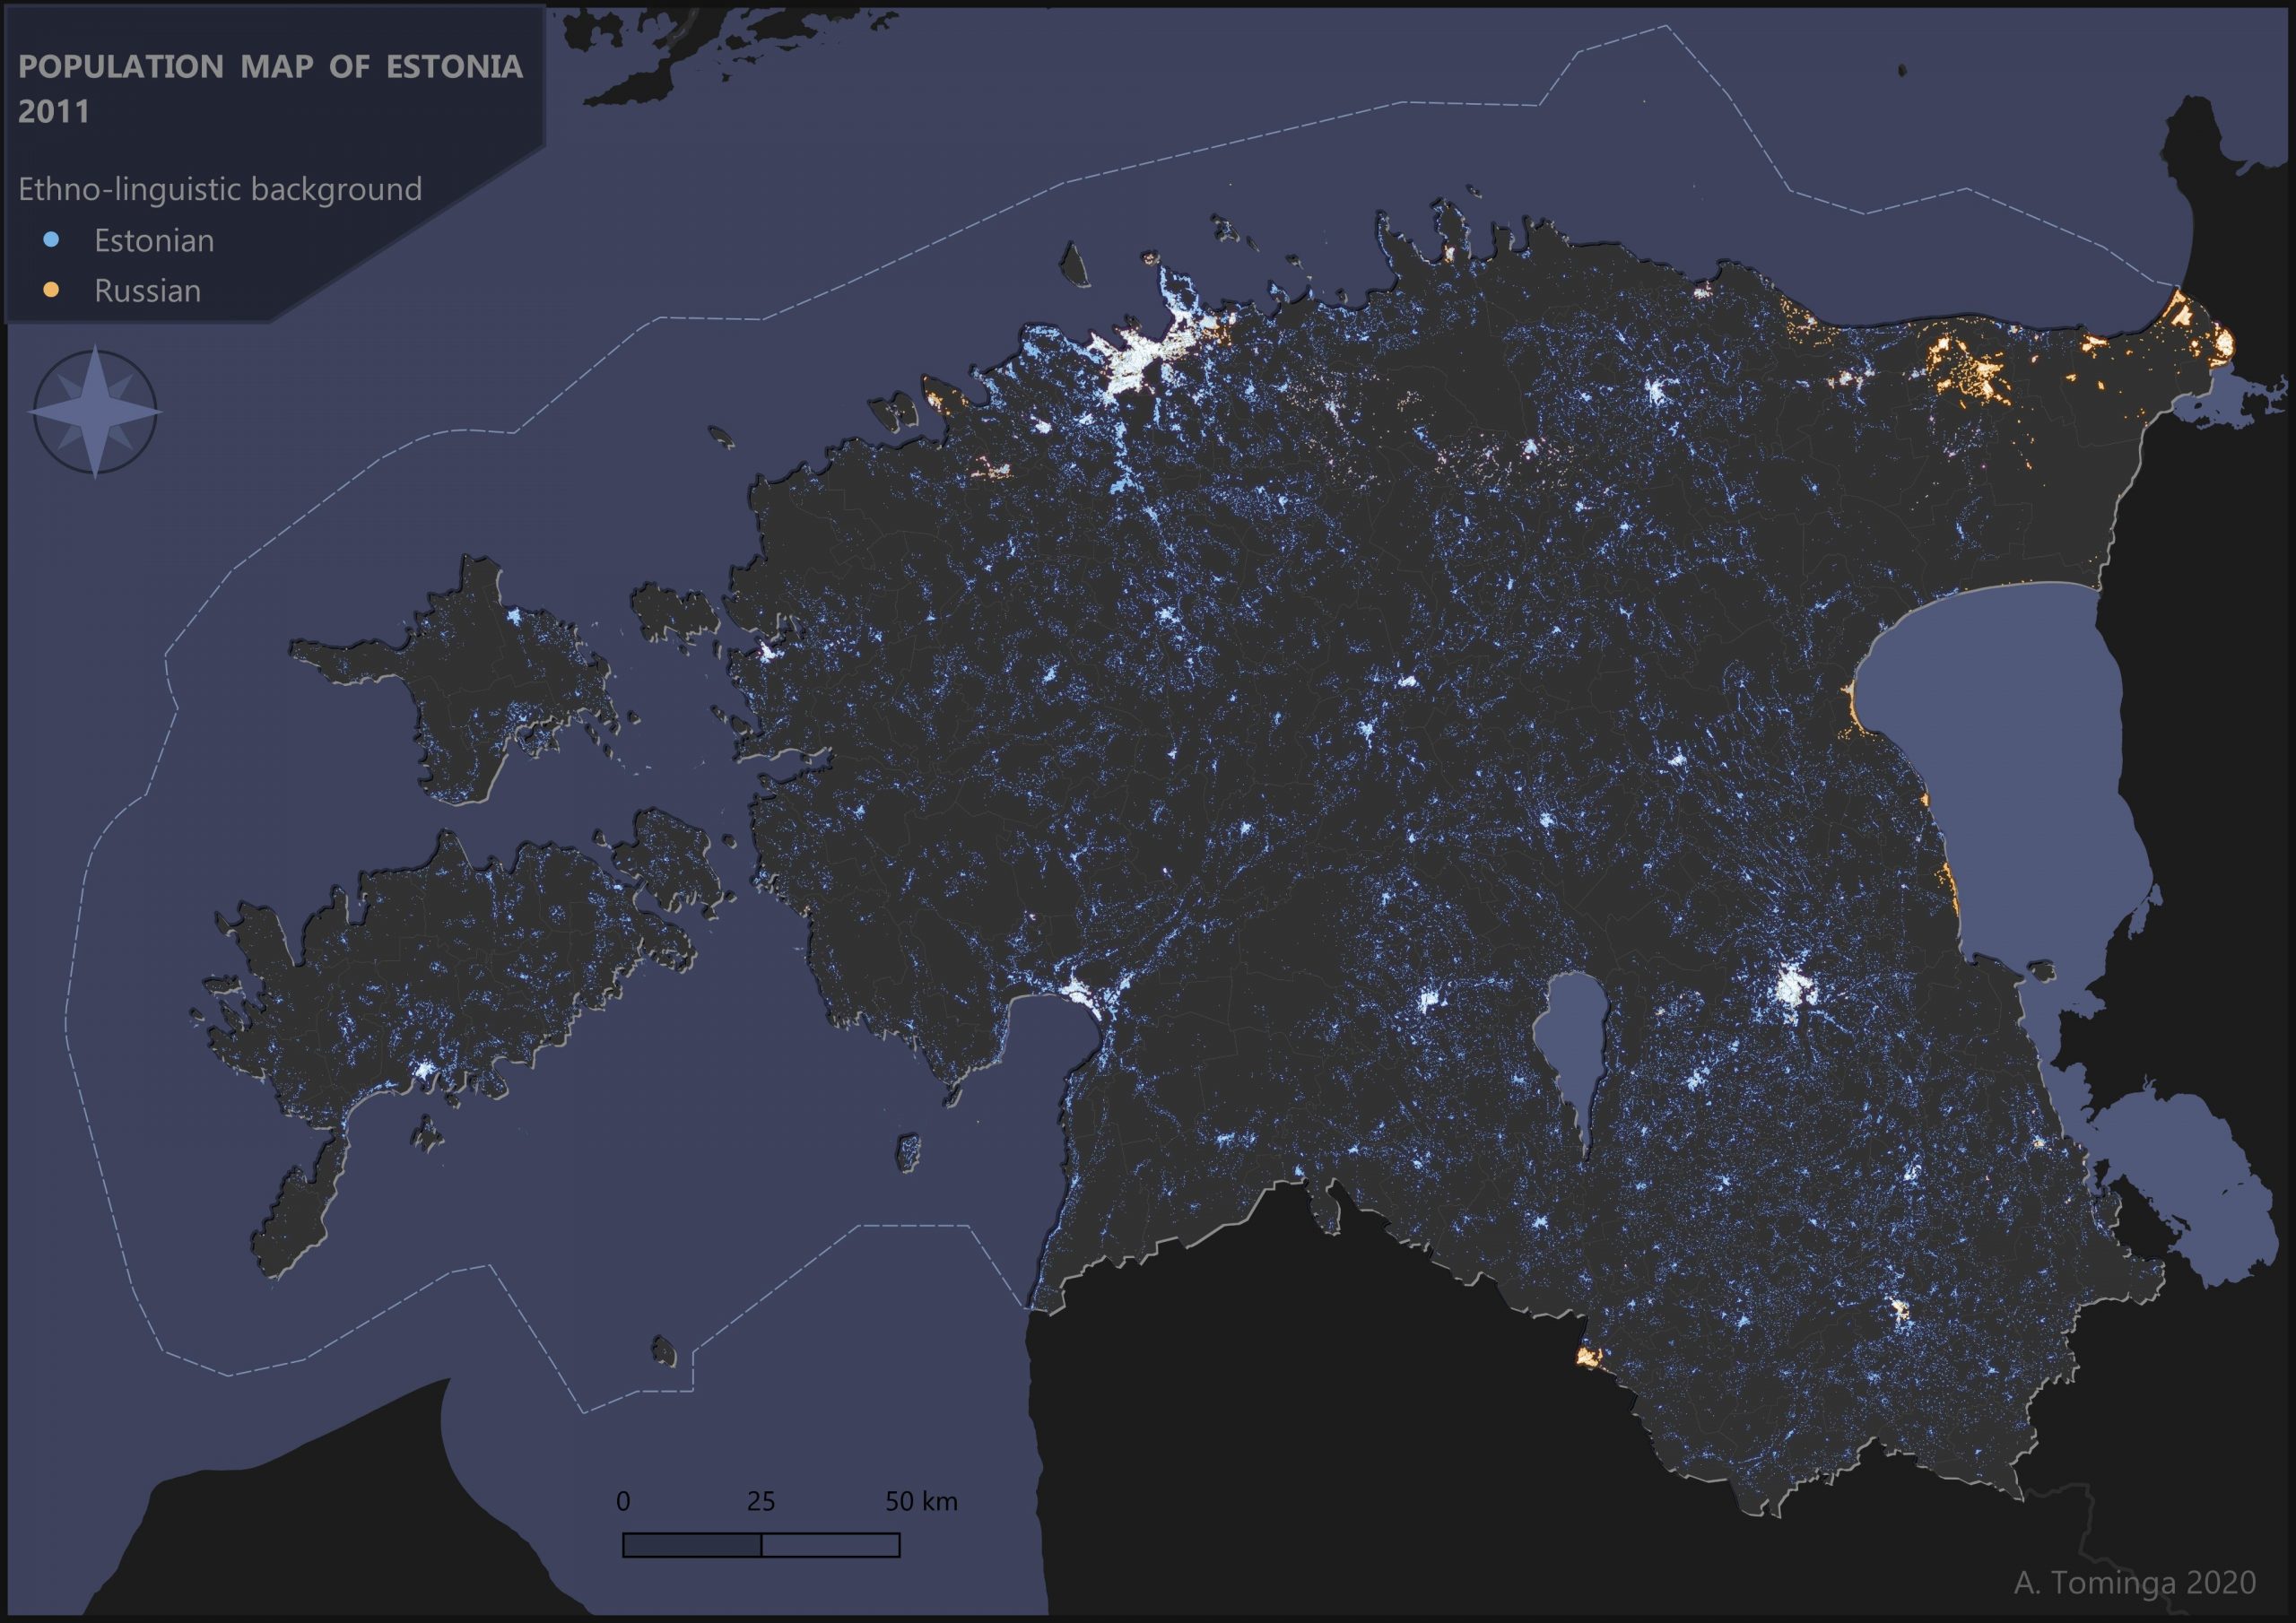
Population map: Estonians and Russians
A population map, where each person is shown as a random point in a residential building. 2011 census data was used to differentiate between ethnic Estonians and Russians. Data: 2011 Population and Housing Census. Map by Ago Tominga / UT Mobility Lab.
Expansion of Tallinn from the 13th century
Data: Building registry. Map by Anto Aasa.
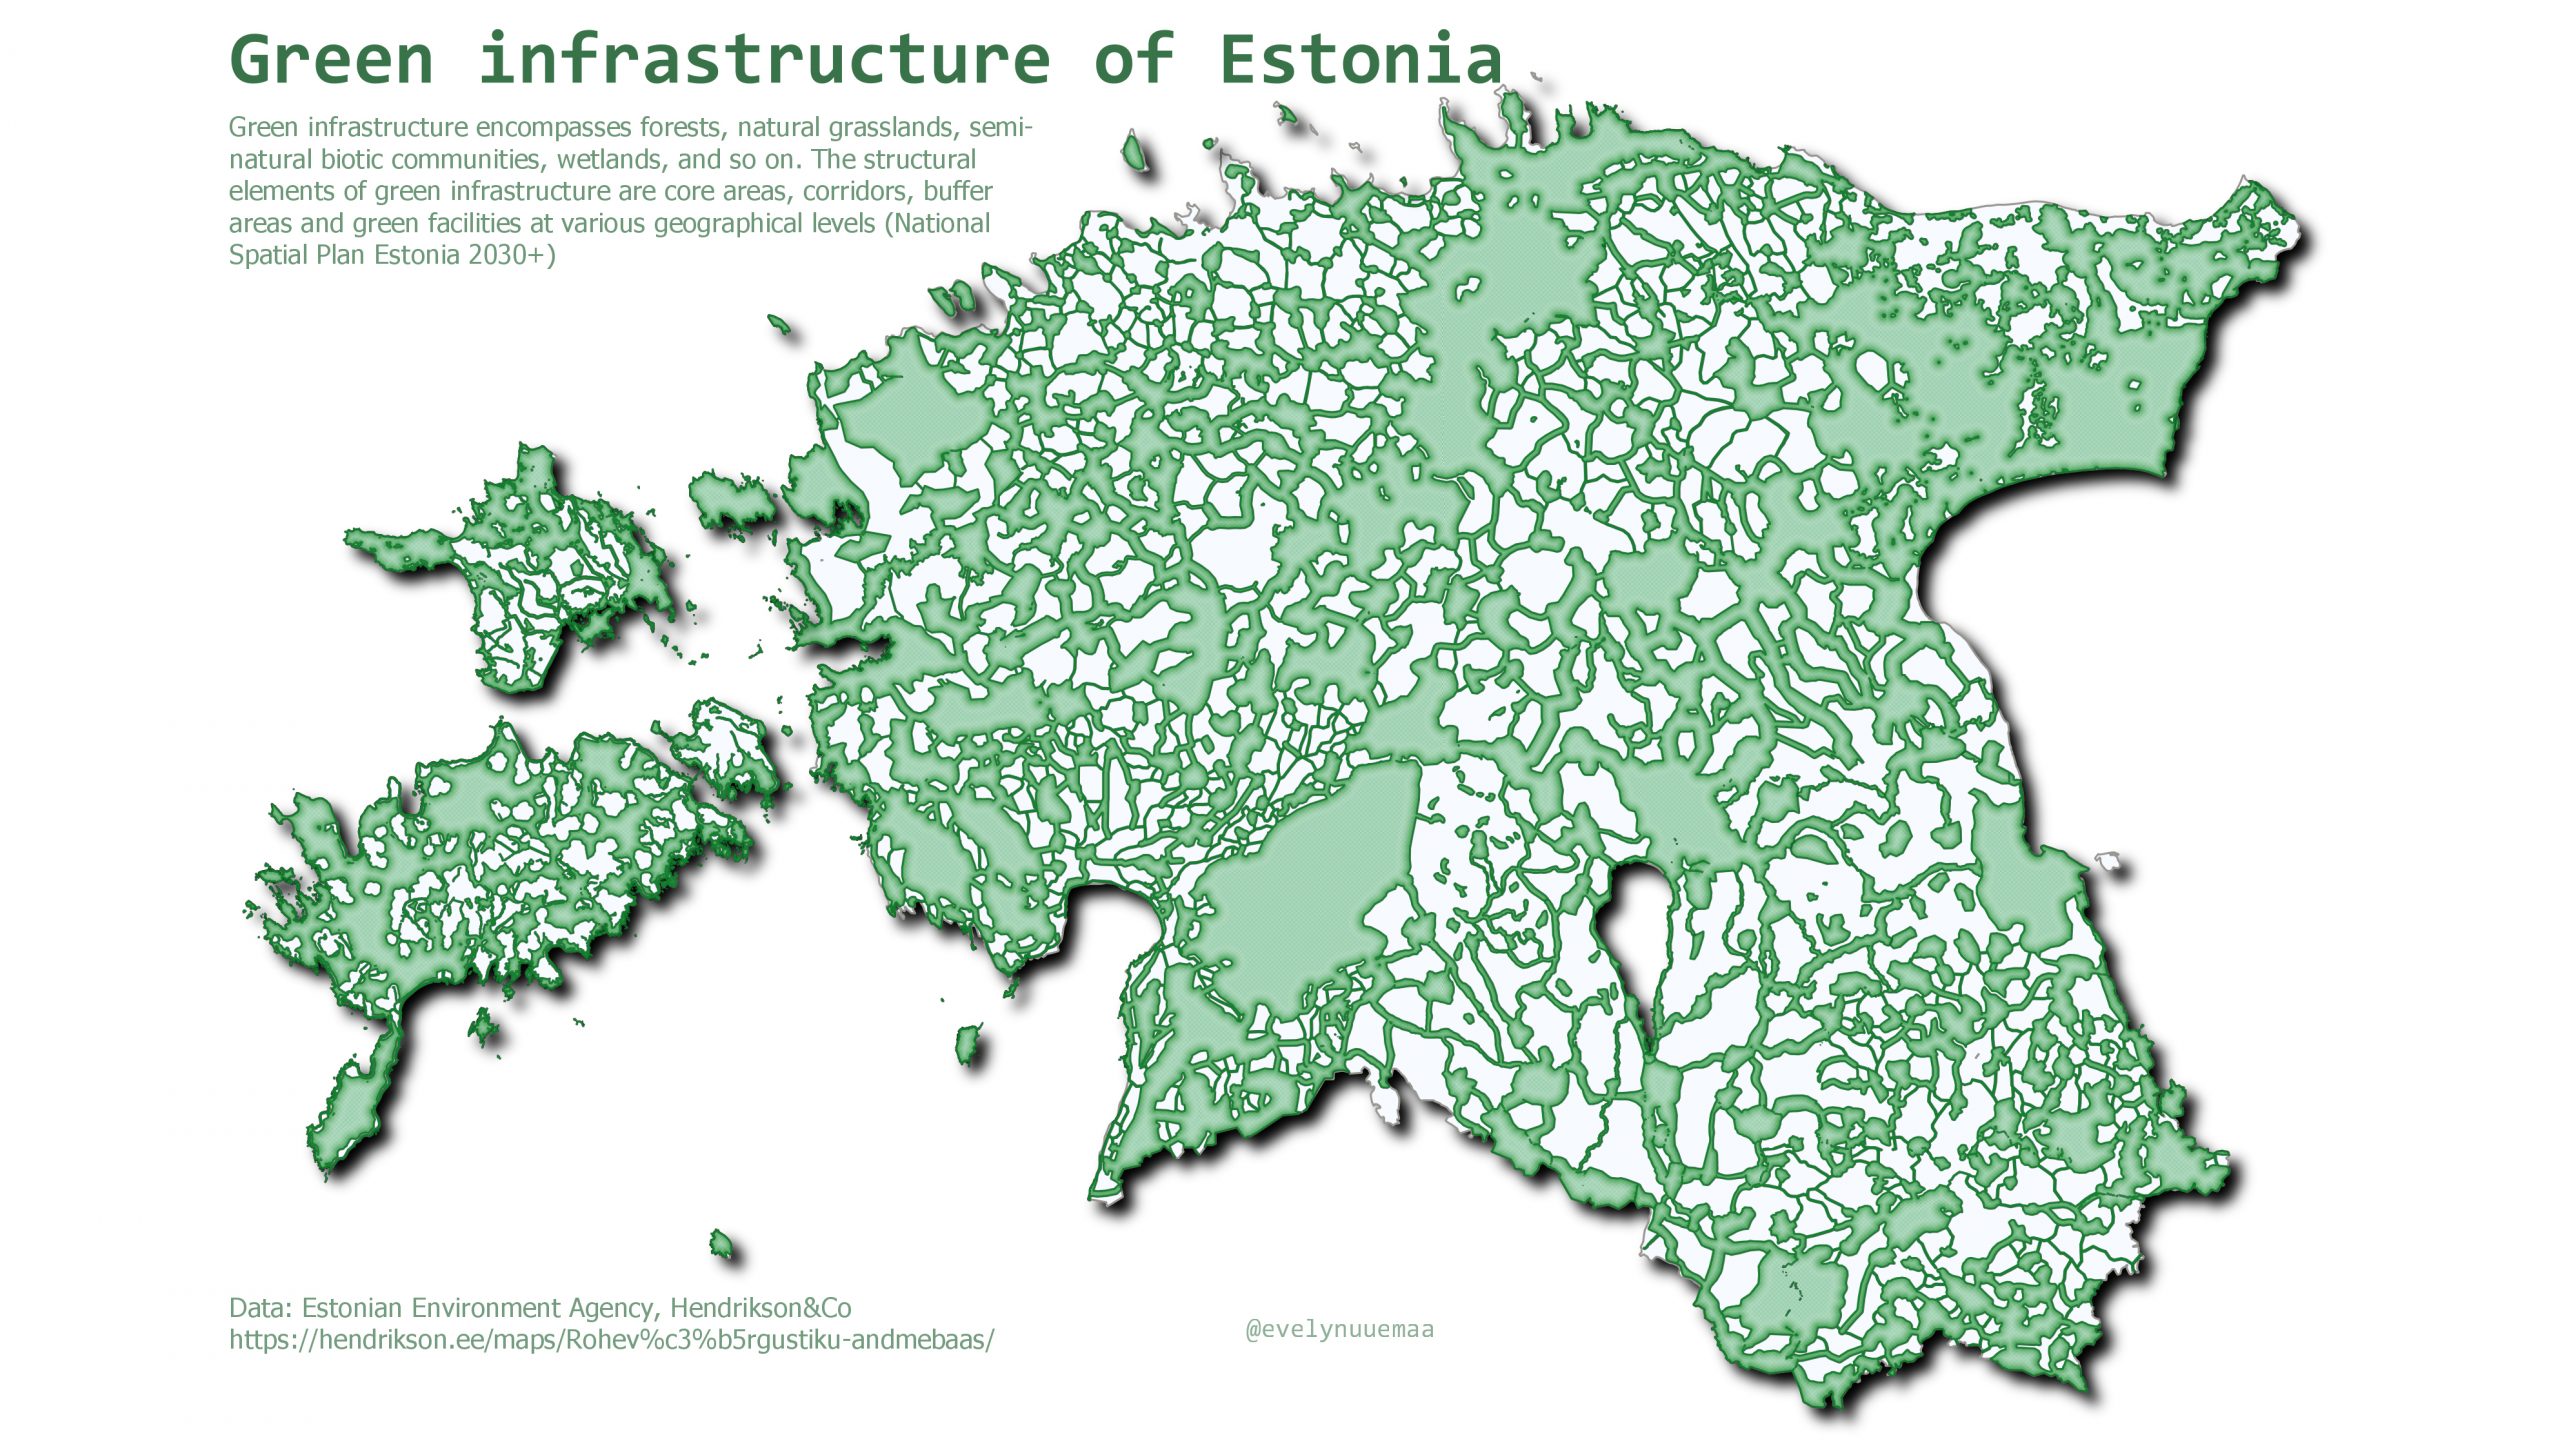
Green infrastructure of Estonia
Green infrastructure encompasses forests, natural grasslands, semi-natural biotic communities, wetlands. Data: Estonian Environmental Agency, Hendrikson & Co. Map by Evelyn Uuemaa.
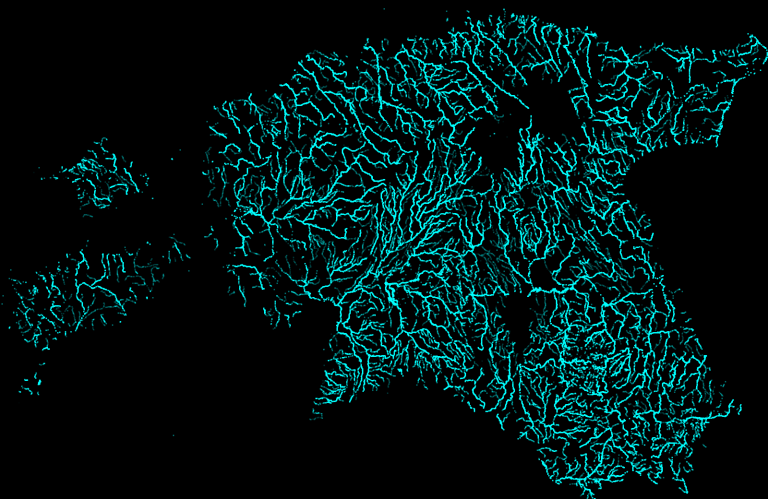
Estonian rivers
Data: Estonian Land Board. Map by Alexander Kmoch.
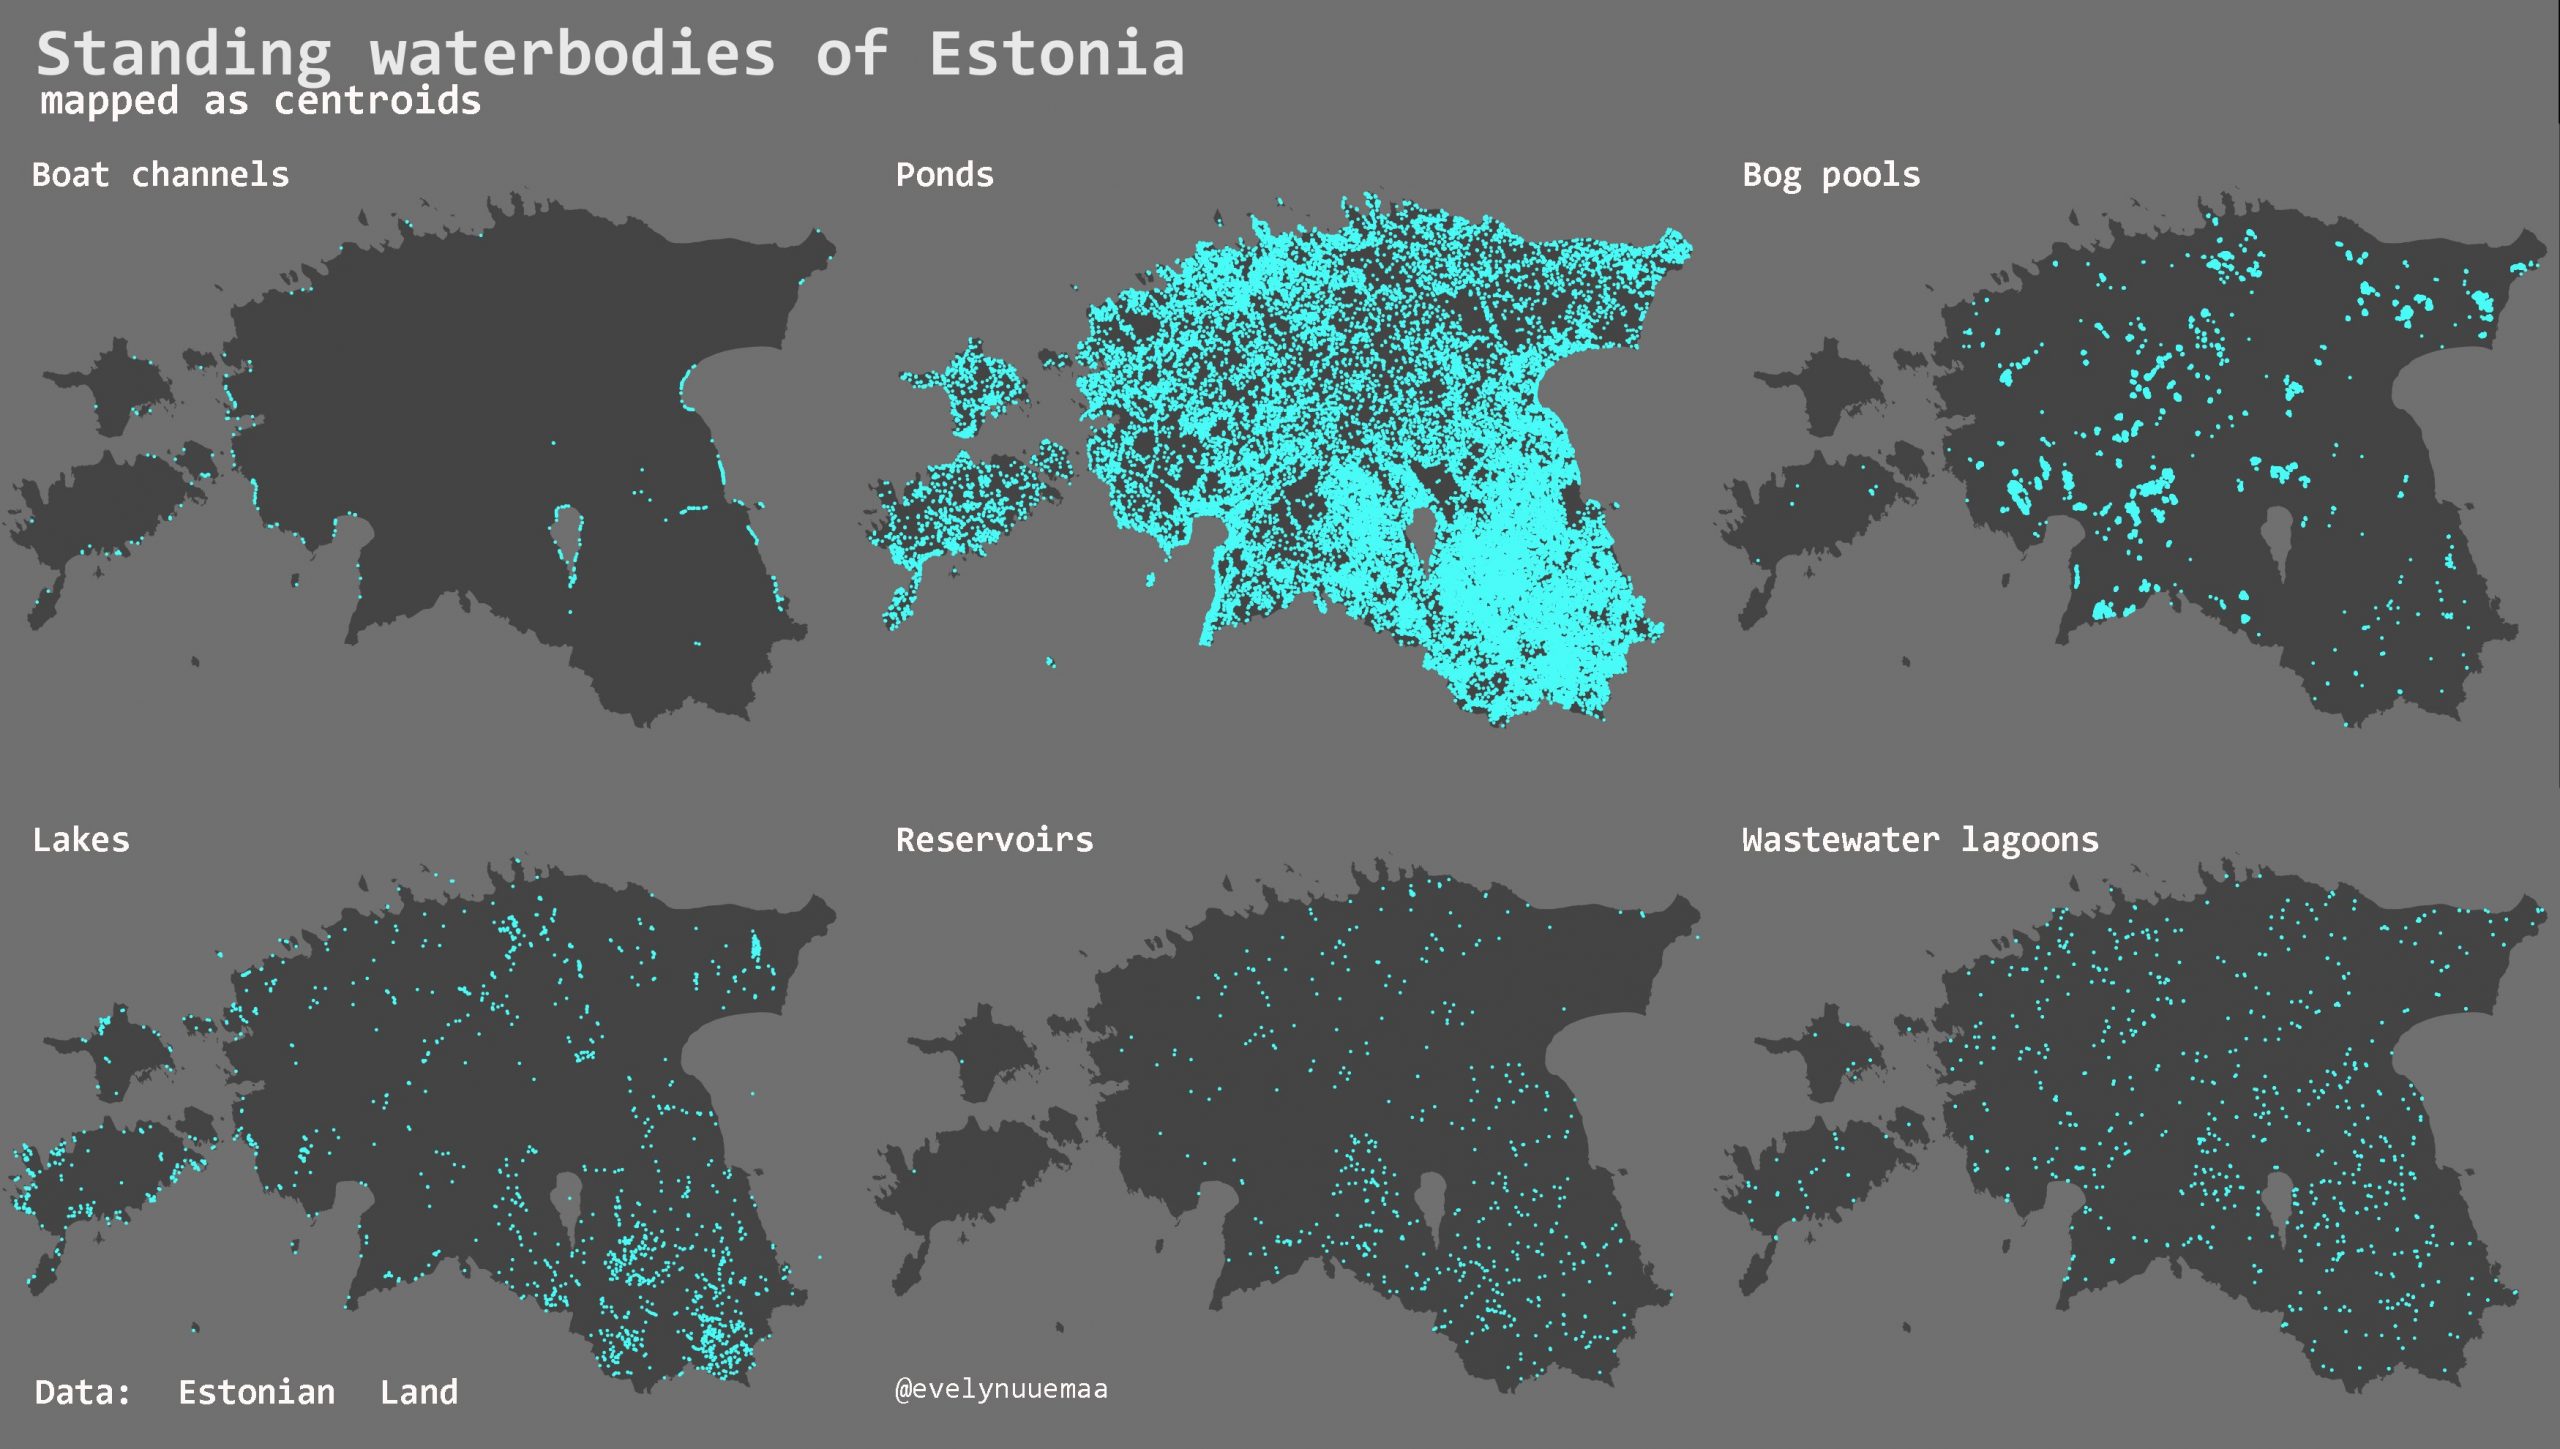
Standing waterbodies of Estonia
Data: Estonian Land Board. A pond for each and every Estonian? Map by Evelyn Uuemaa.
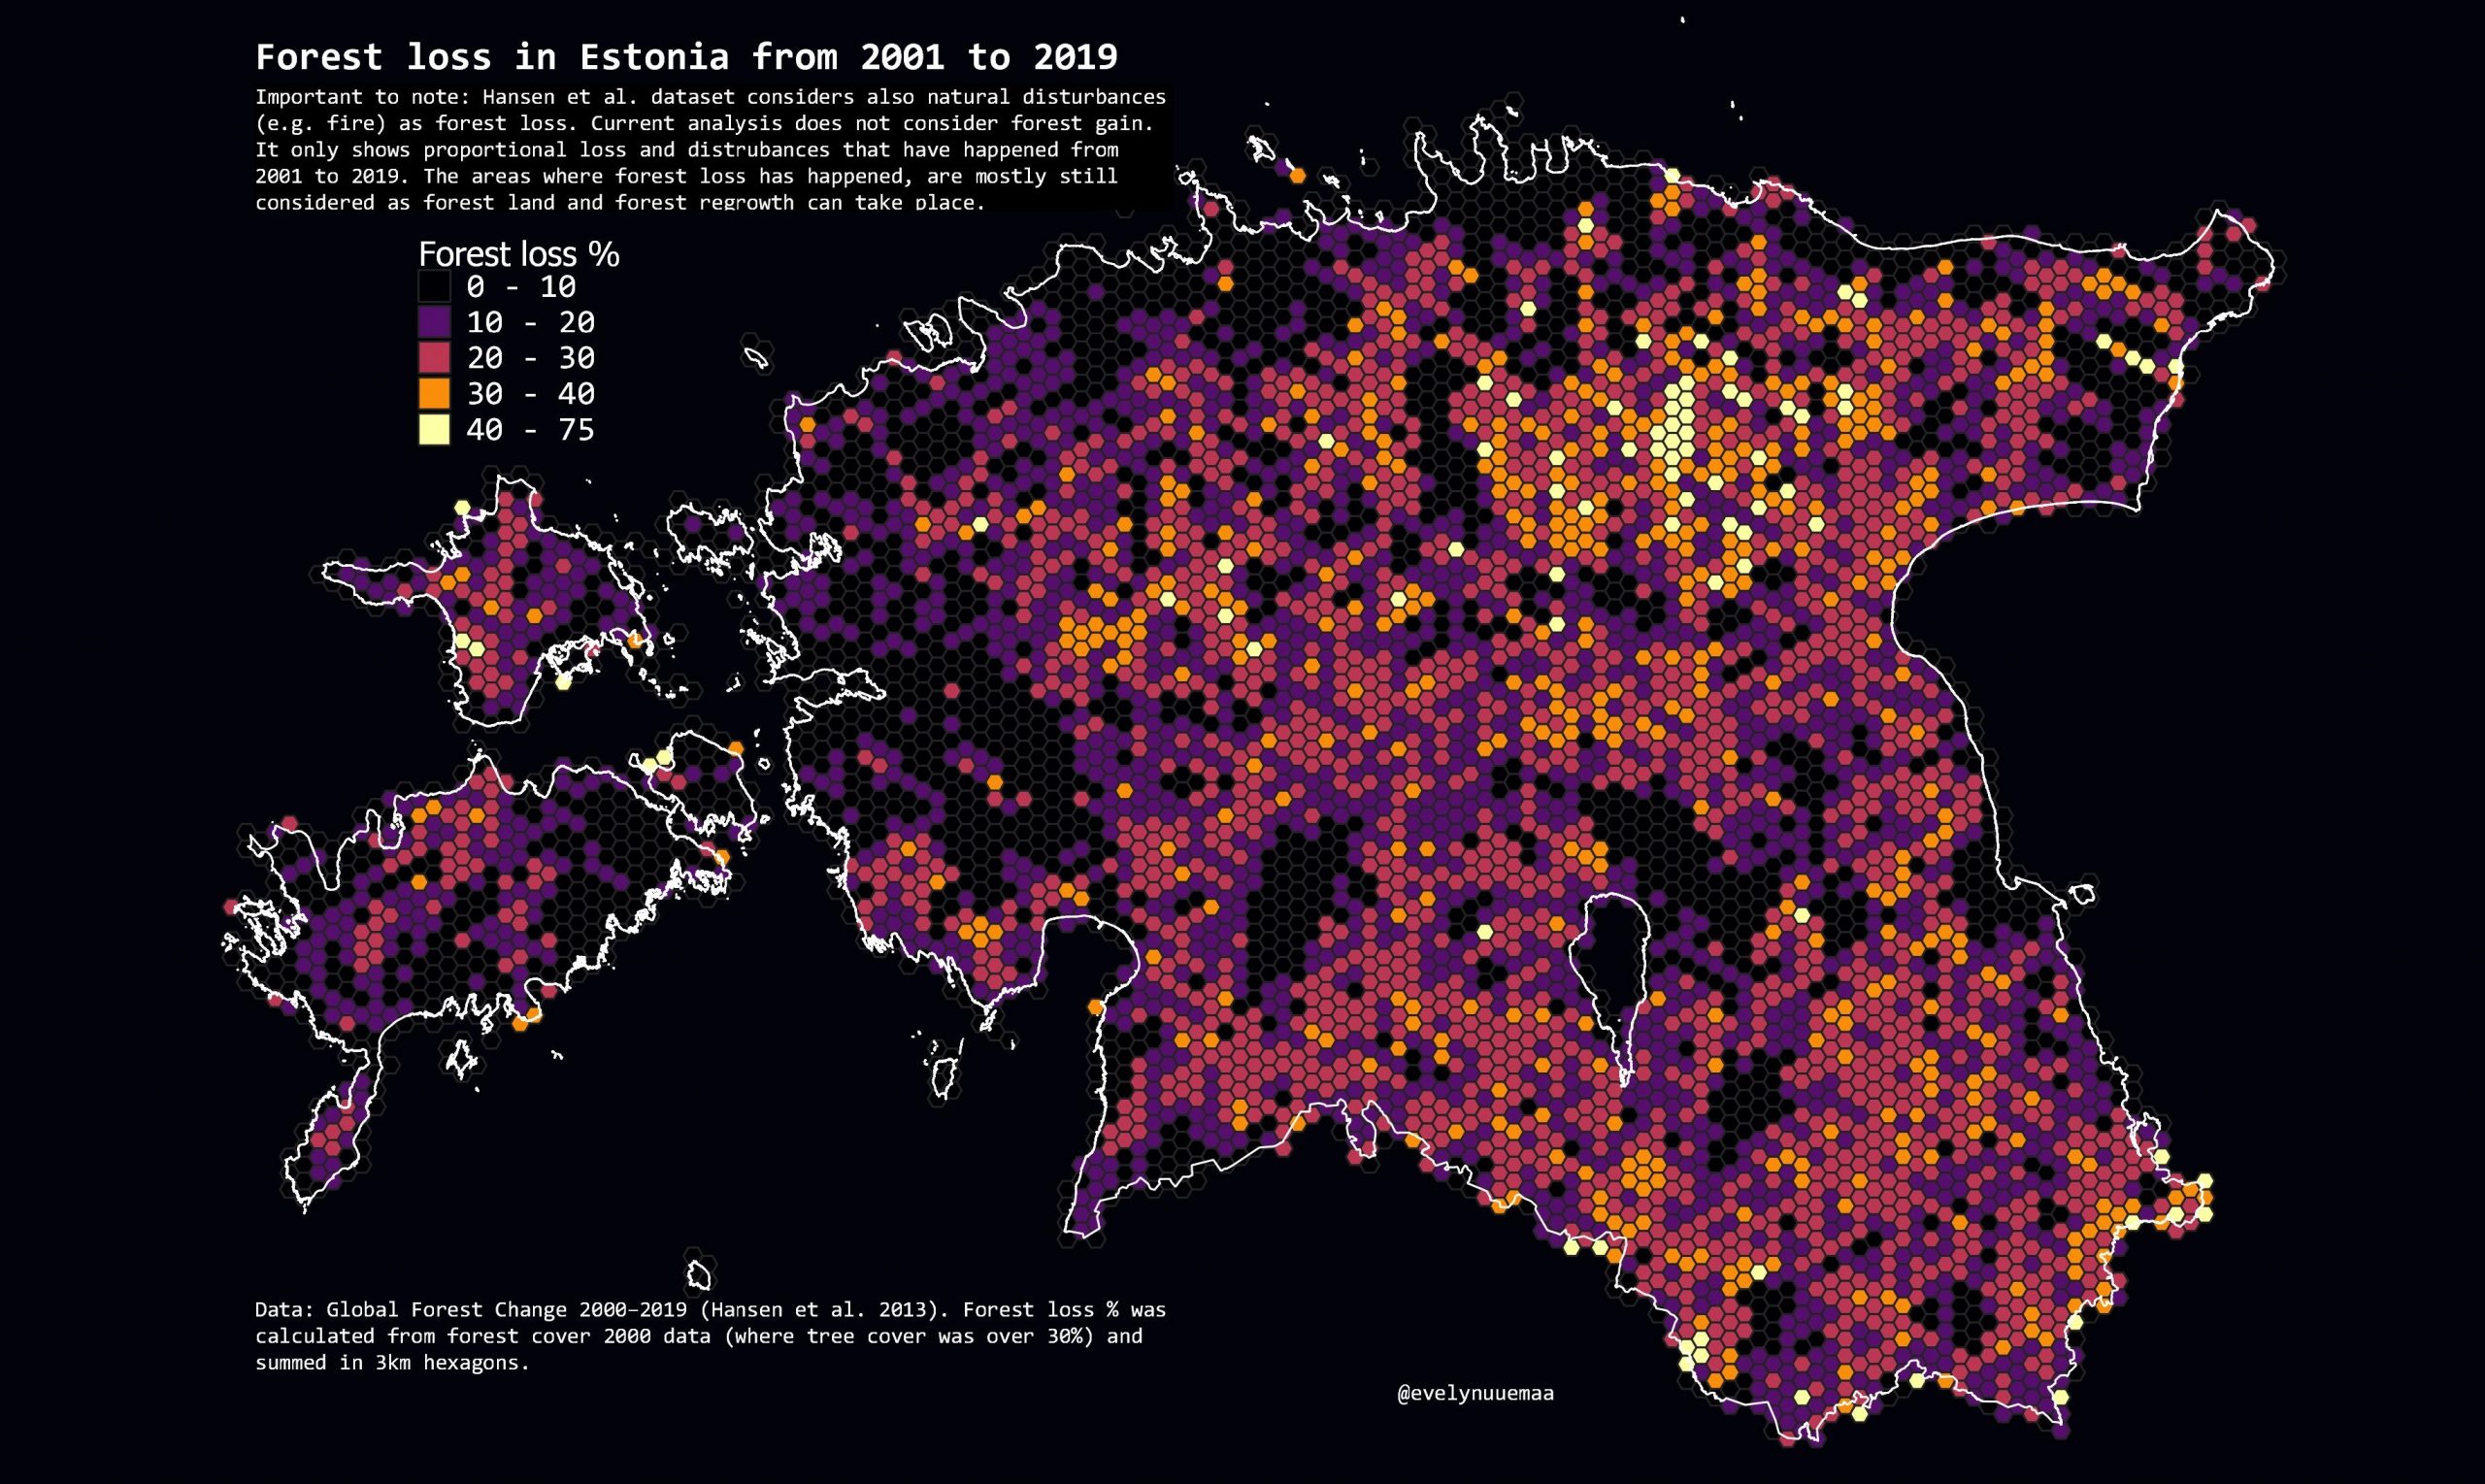
Forest loss in Estonia from 2001 to 2019
The current analysis does not consider forest gain. It only shows proportional loss and disturbances. The areas where forest loss has happened are mostly still considered as forest land and forest regrowth can take place. Data: Global Forest Change (Hansen et al. 2013). Map by Evelyn Uuemaa.
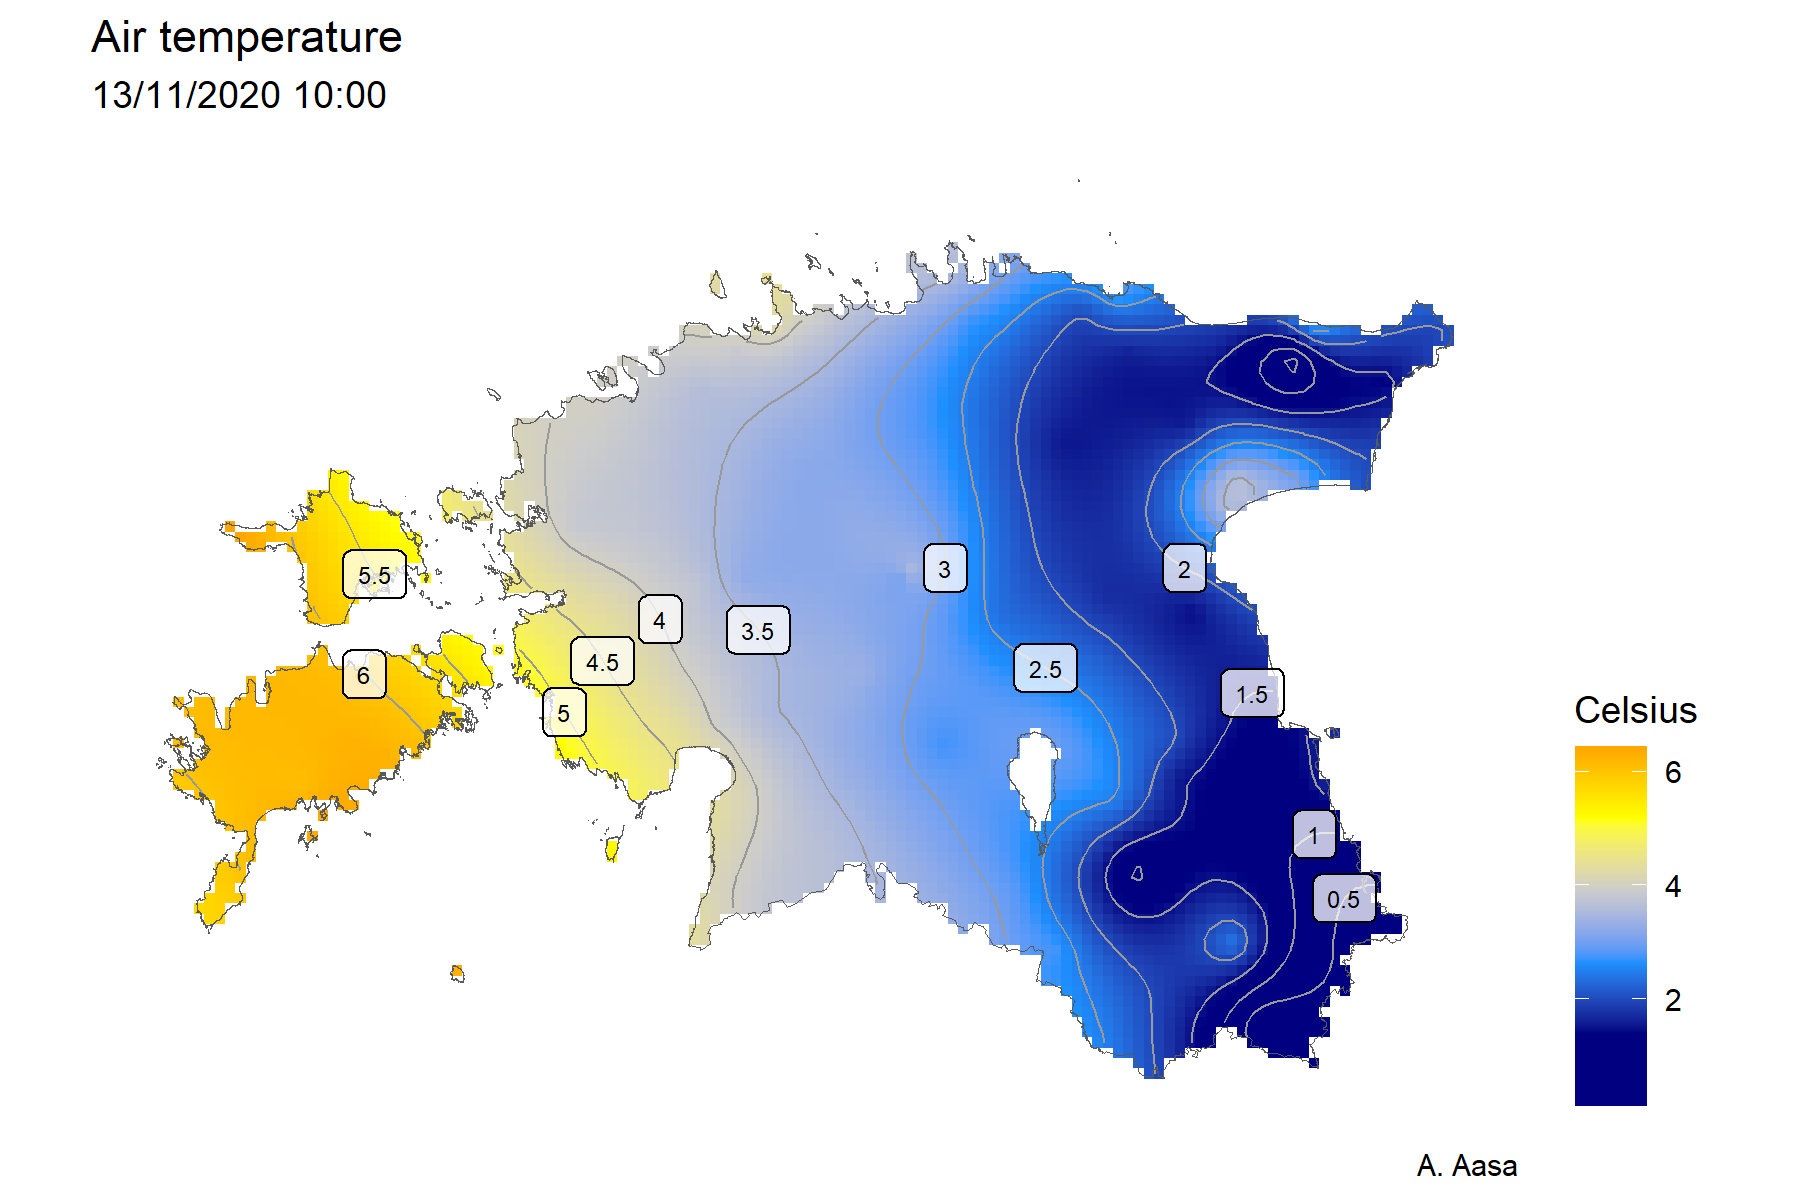
Air temperature in Estonia on 13 November 2020
Estonia is small, but there is still variation in temperature. Data: Estonian Weather Service. Map by Anto Aasa.
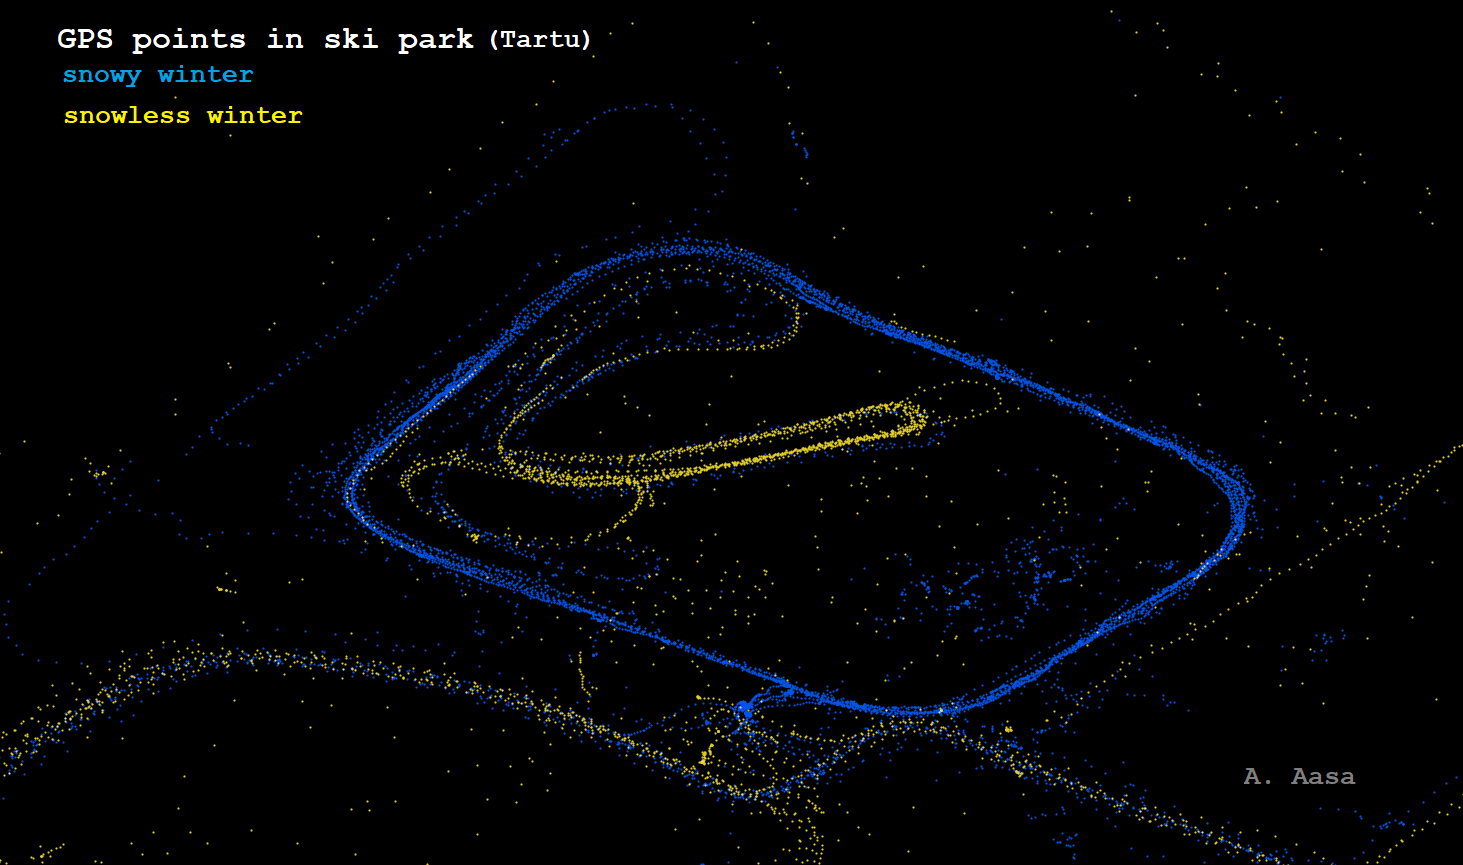
Climate change
In snowy winters, people follow the ski track. Map by Anto Aasa / UT Mobility Lab.
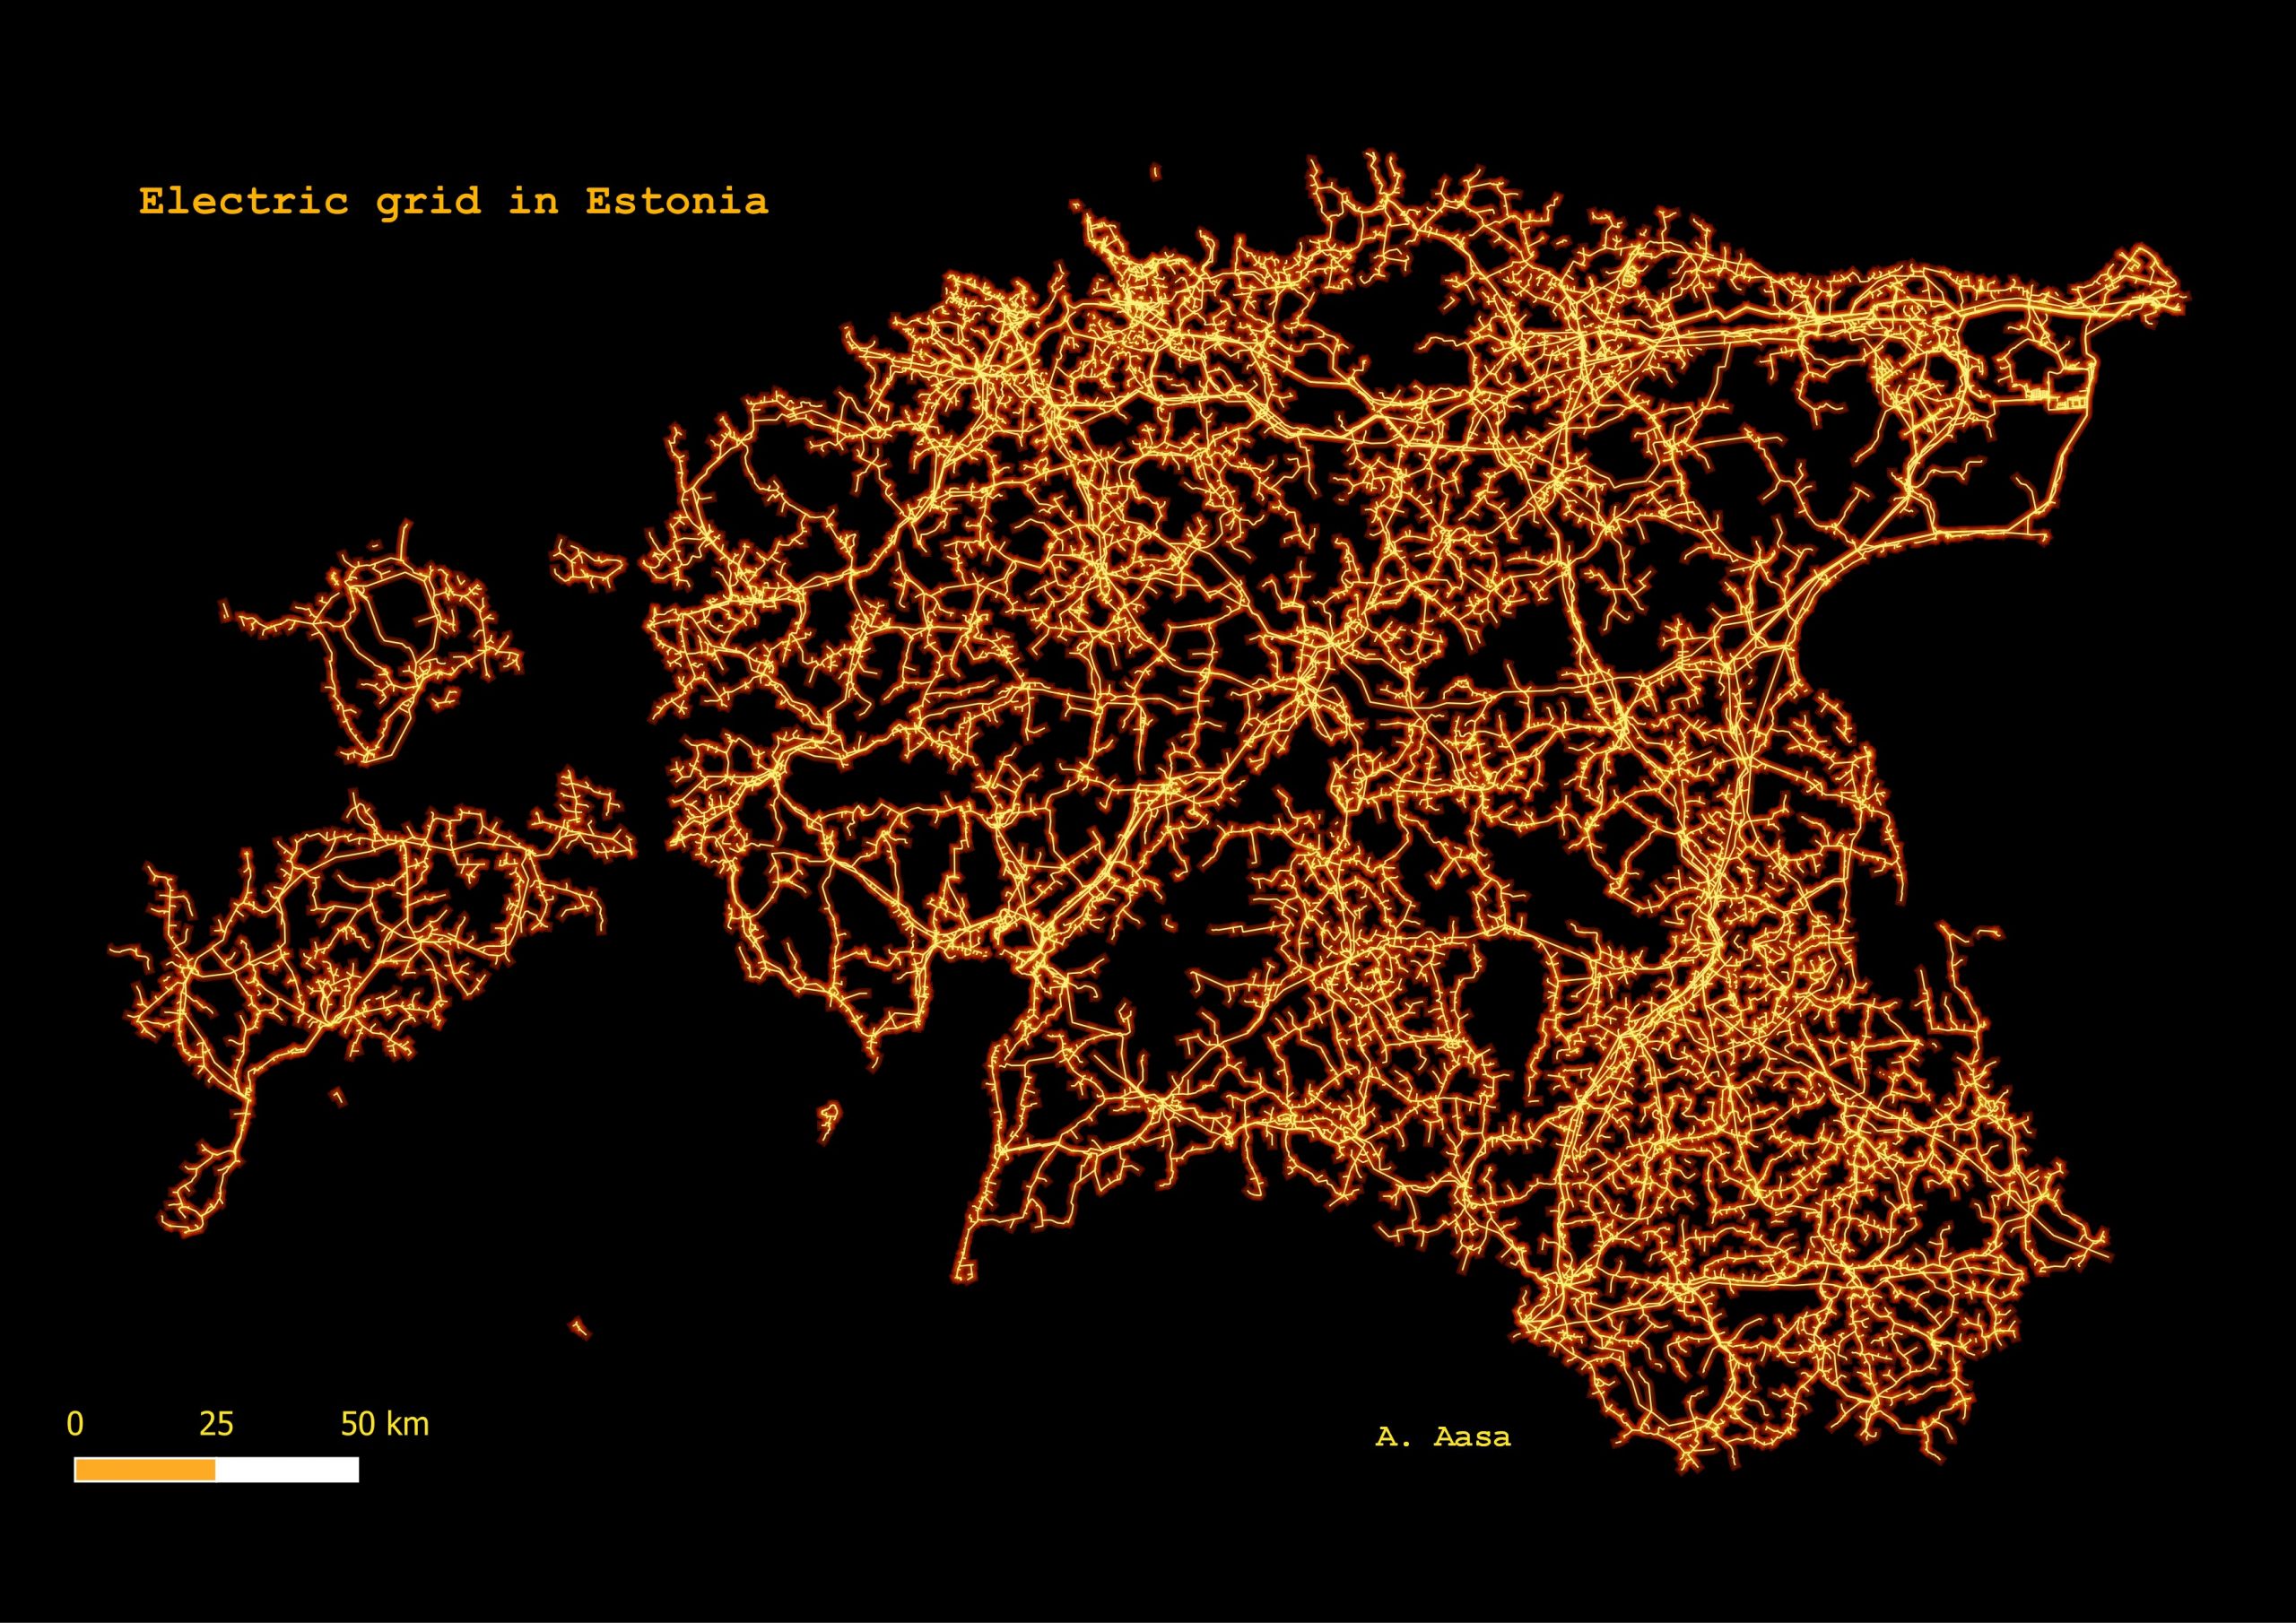
The electric grid in Estonia
Data: Land Board, Estonian Topographic Database. Map by Anto Aasa.
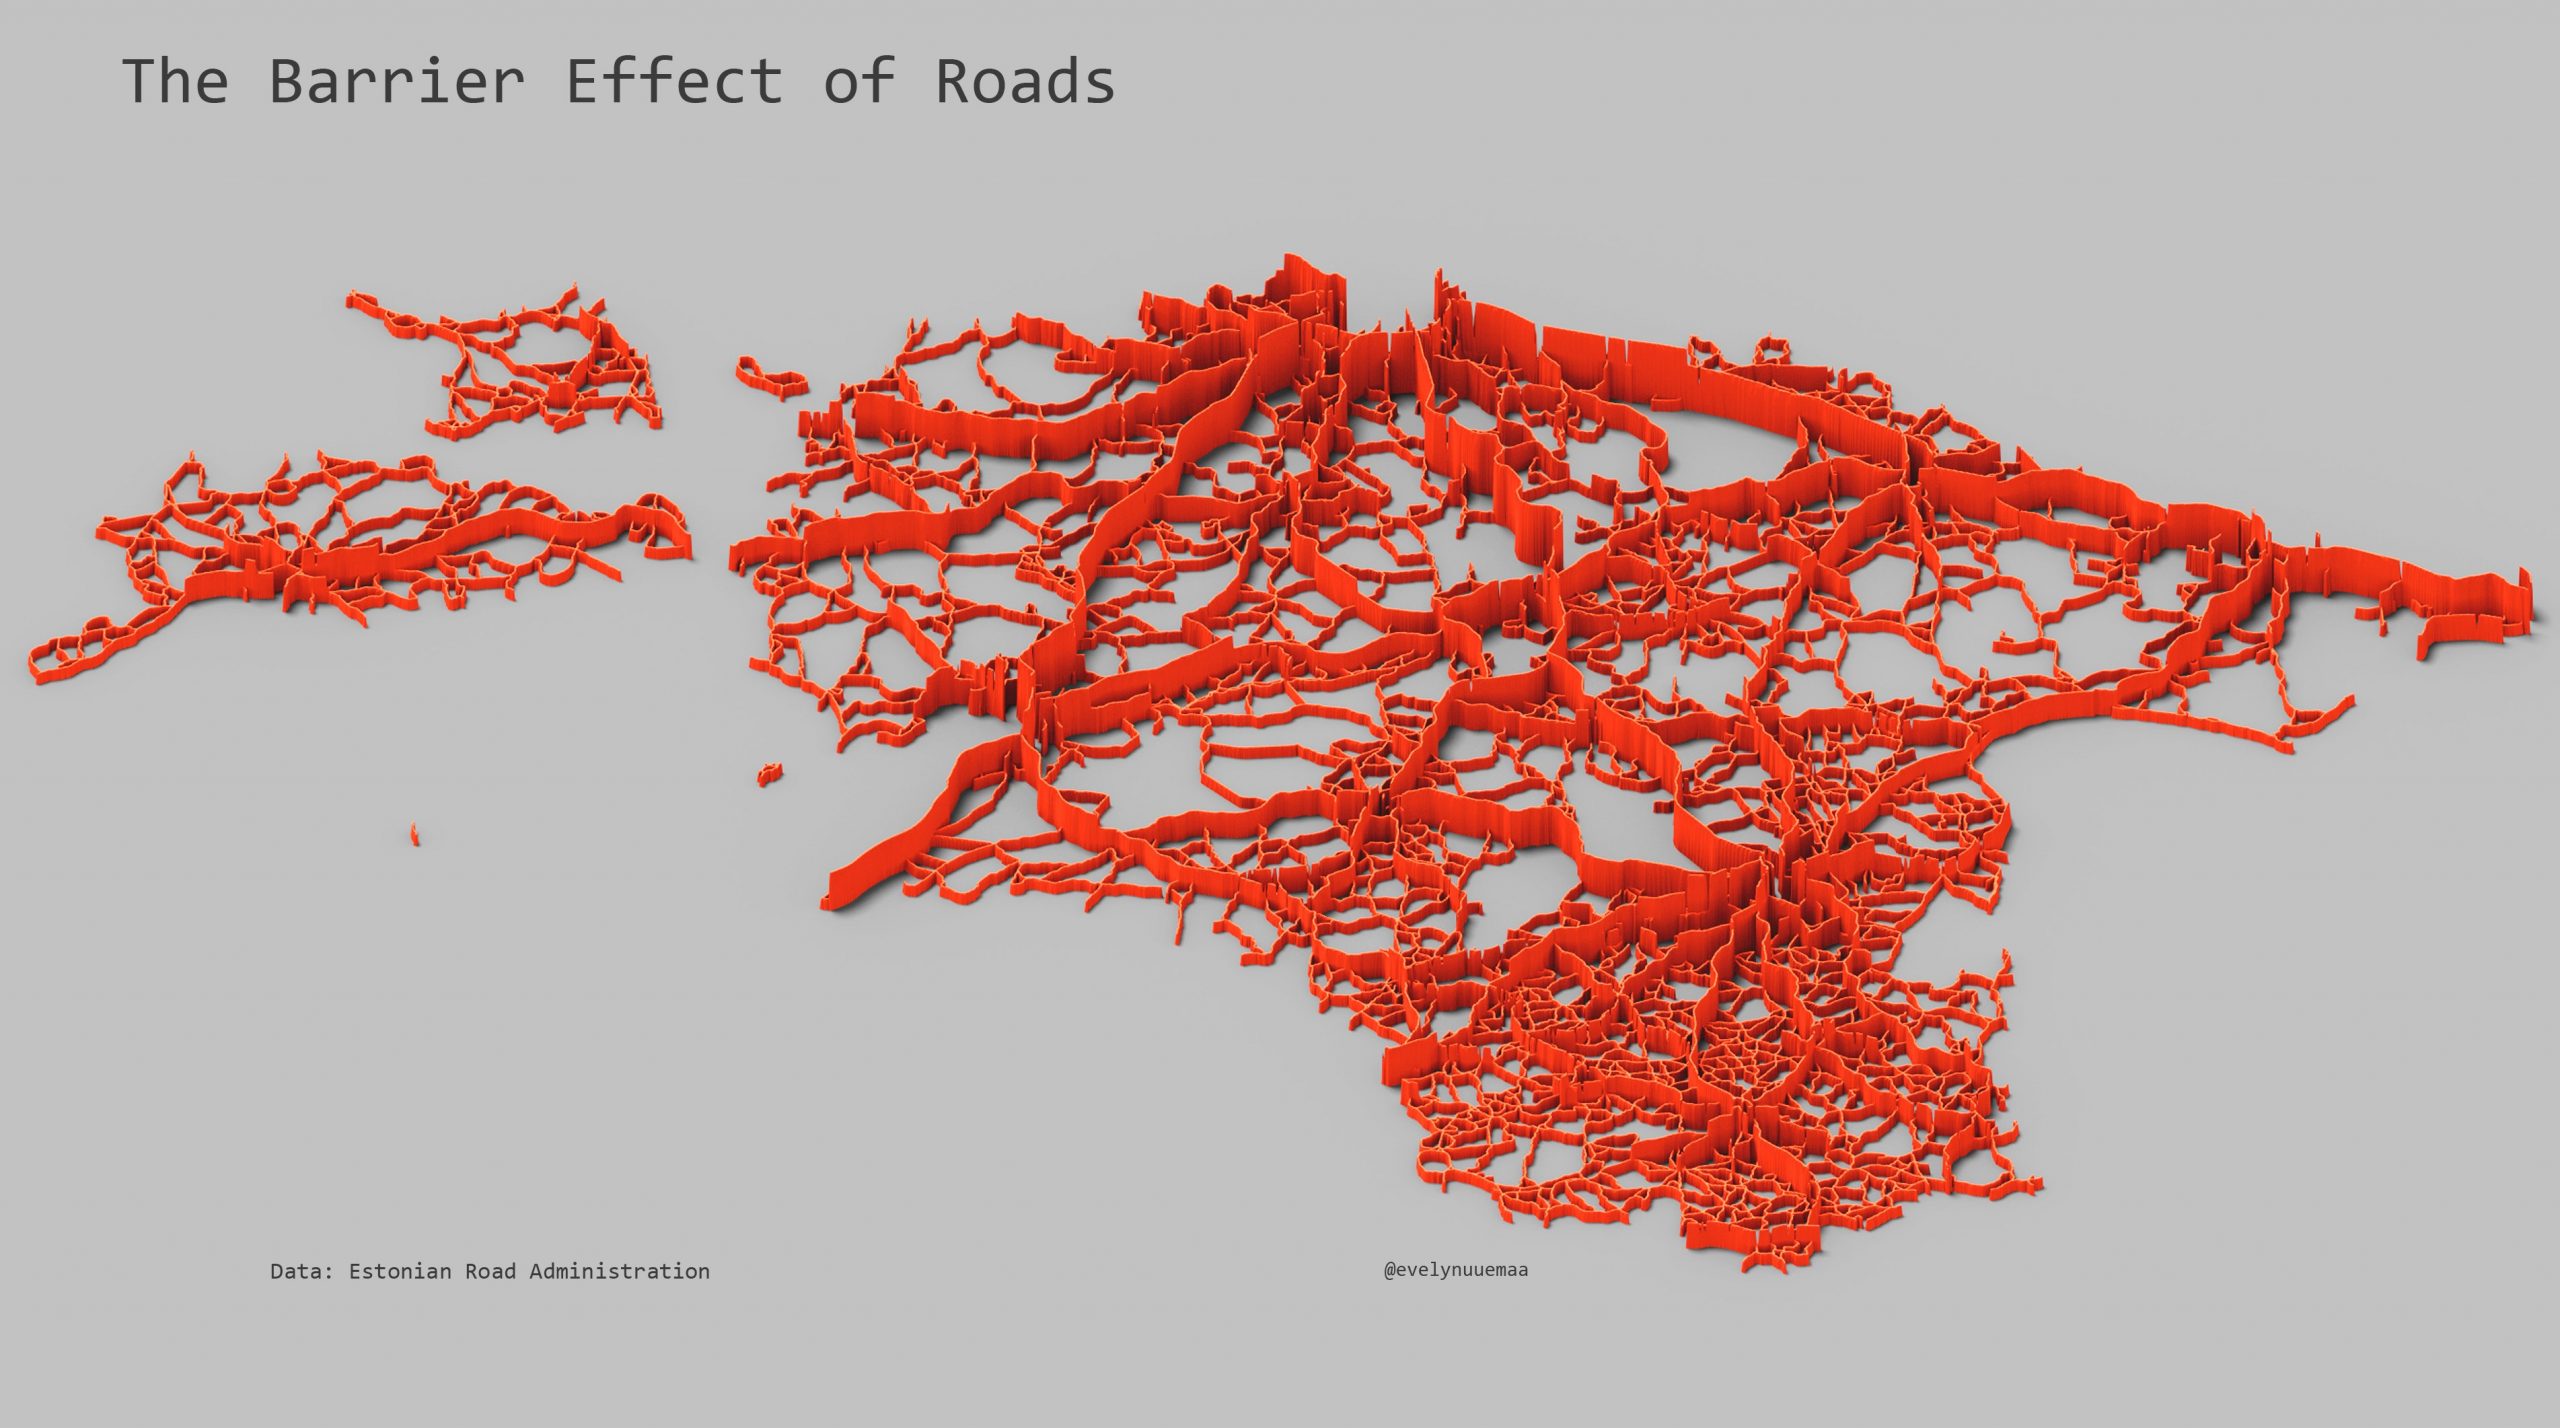
The barrier effect of roads
The roads were extruded based on the traffic intensity. Data: Estonian Road Administration. Map by Evelyn Uuemaa.
Manufacturing ‘chimneys’ in Estonia
High ‘chimneys’ indicate where manufacturing is located. Data: Land Board, Estonian Topographic Database. Map by Anto Aasa.
Number of companies in Tallinn
Data: Land Board; address data, Business Register. Map by Anto Aasa.
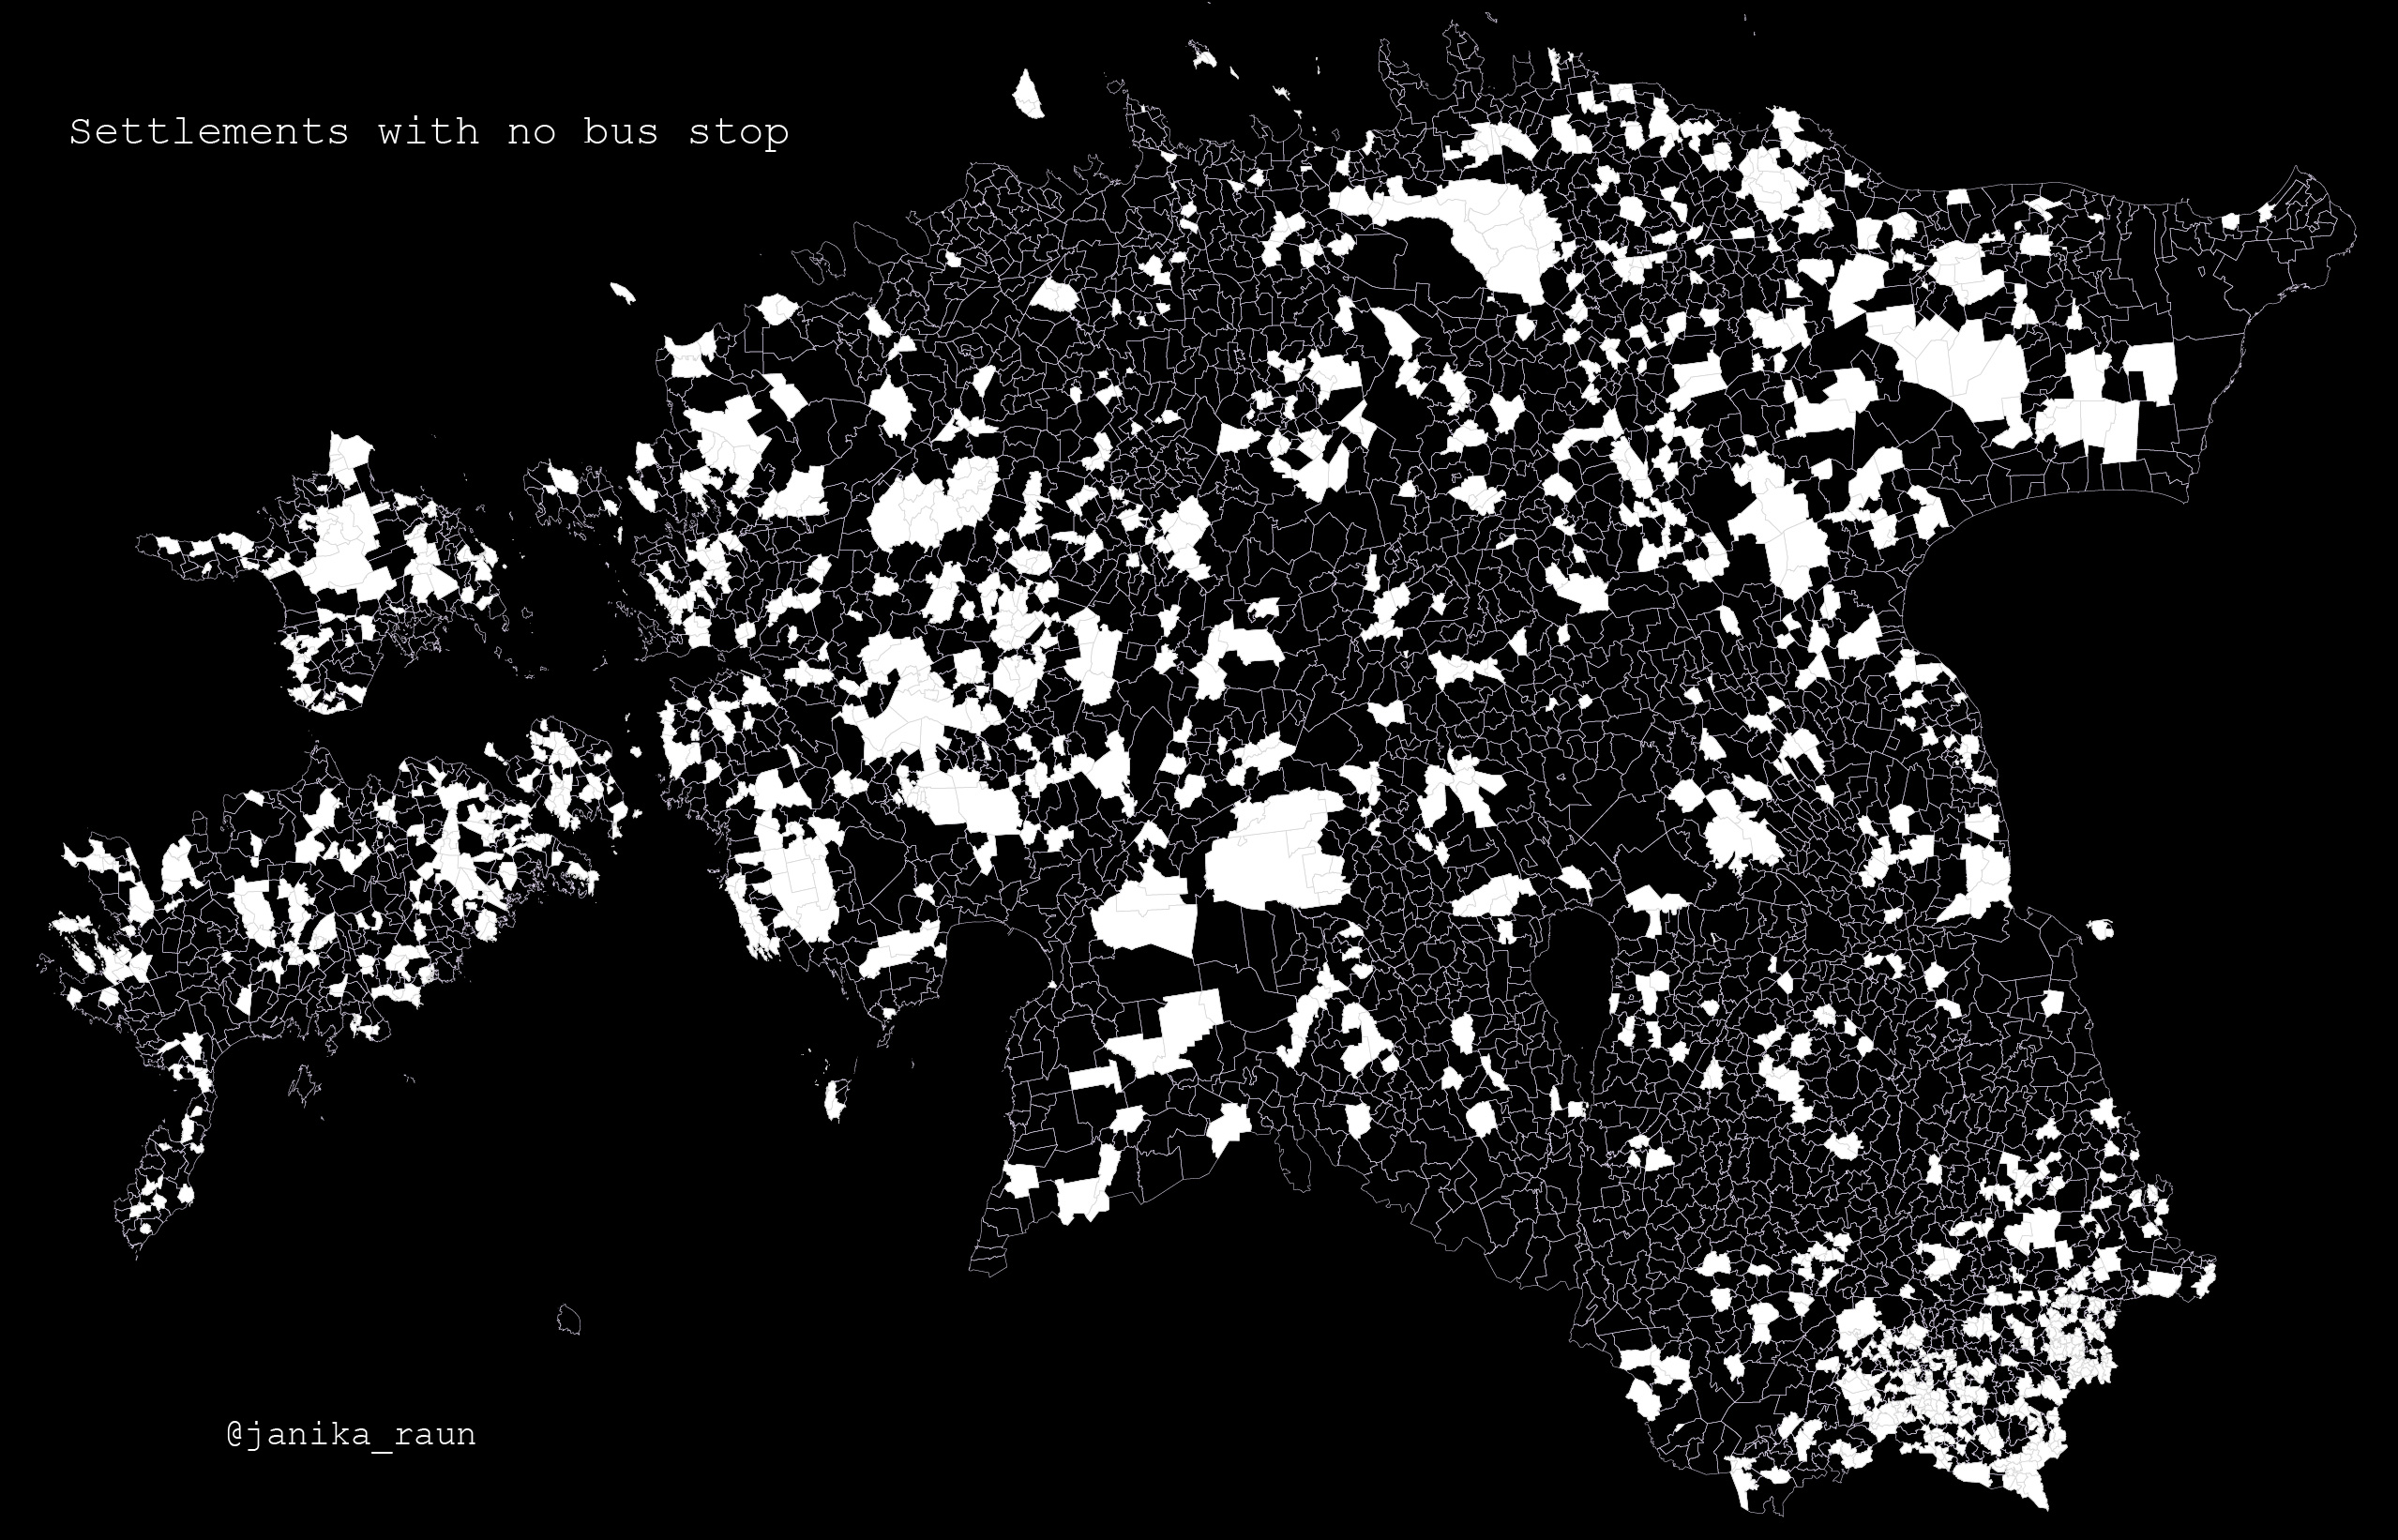
Settlements with no bus stops
Data: GTFS. Map by Janika Raun.
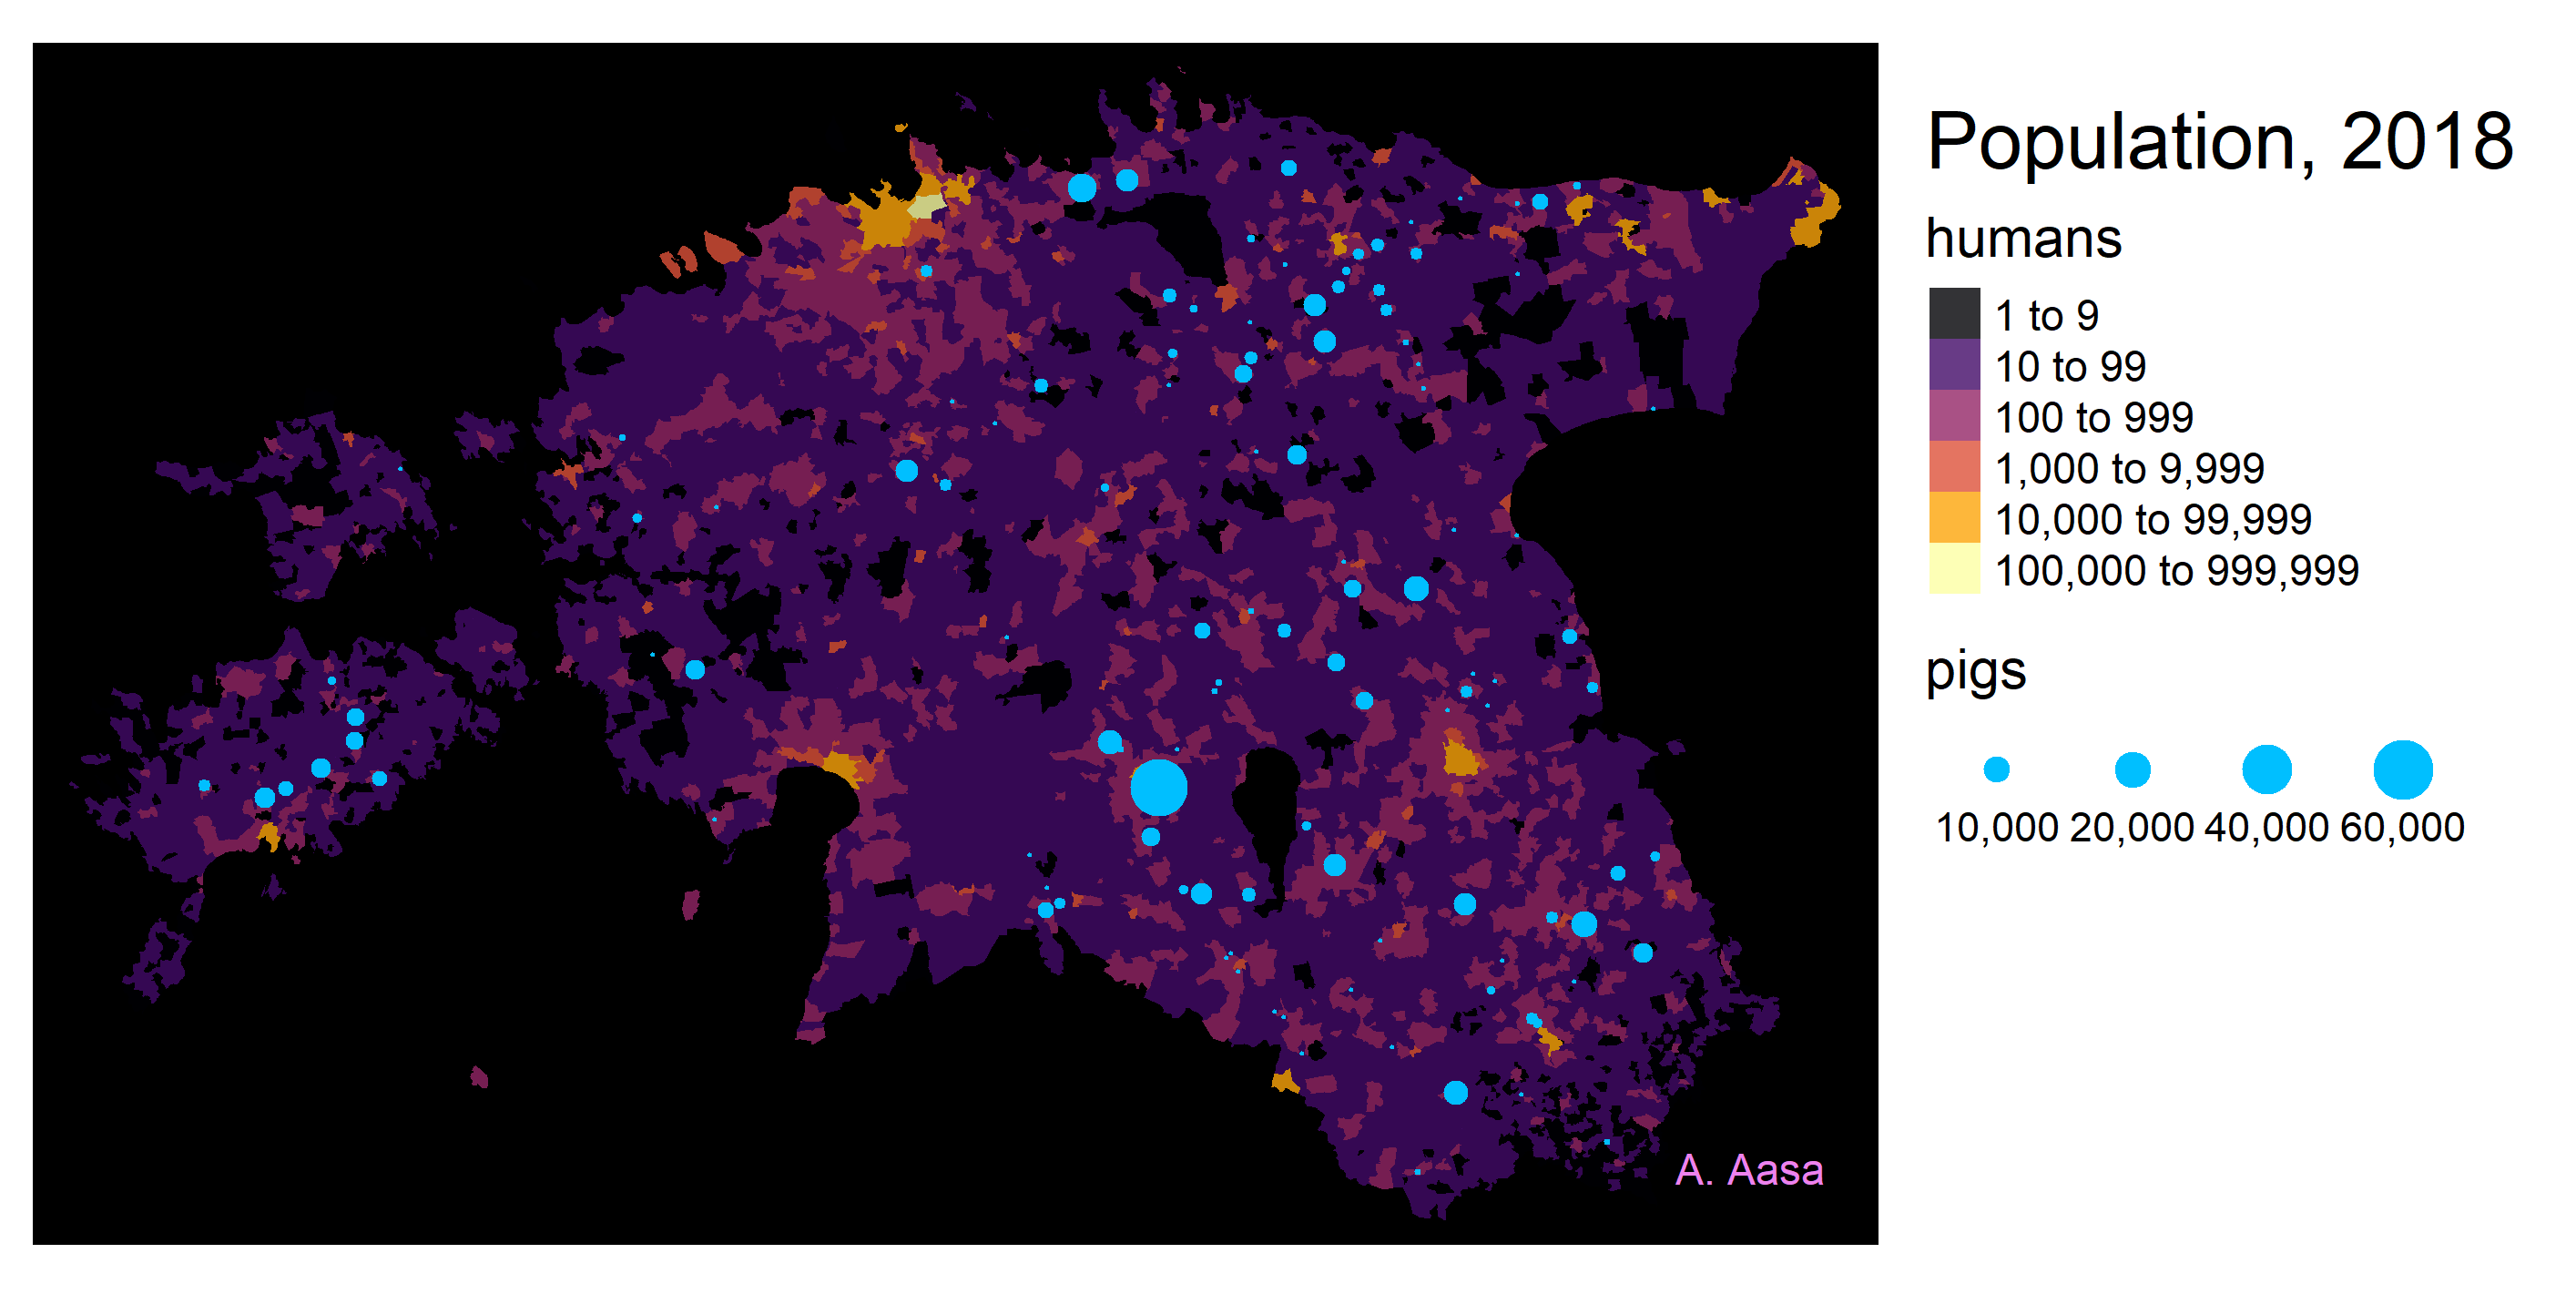
Population of humans and pigs
Data: Statistics Estonia, population register; Estonian Livestock Performance Recording Ltd. Map by Anto Aasa.
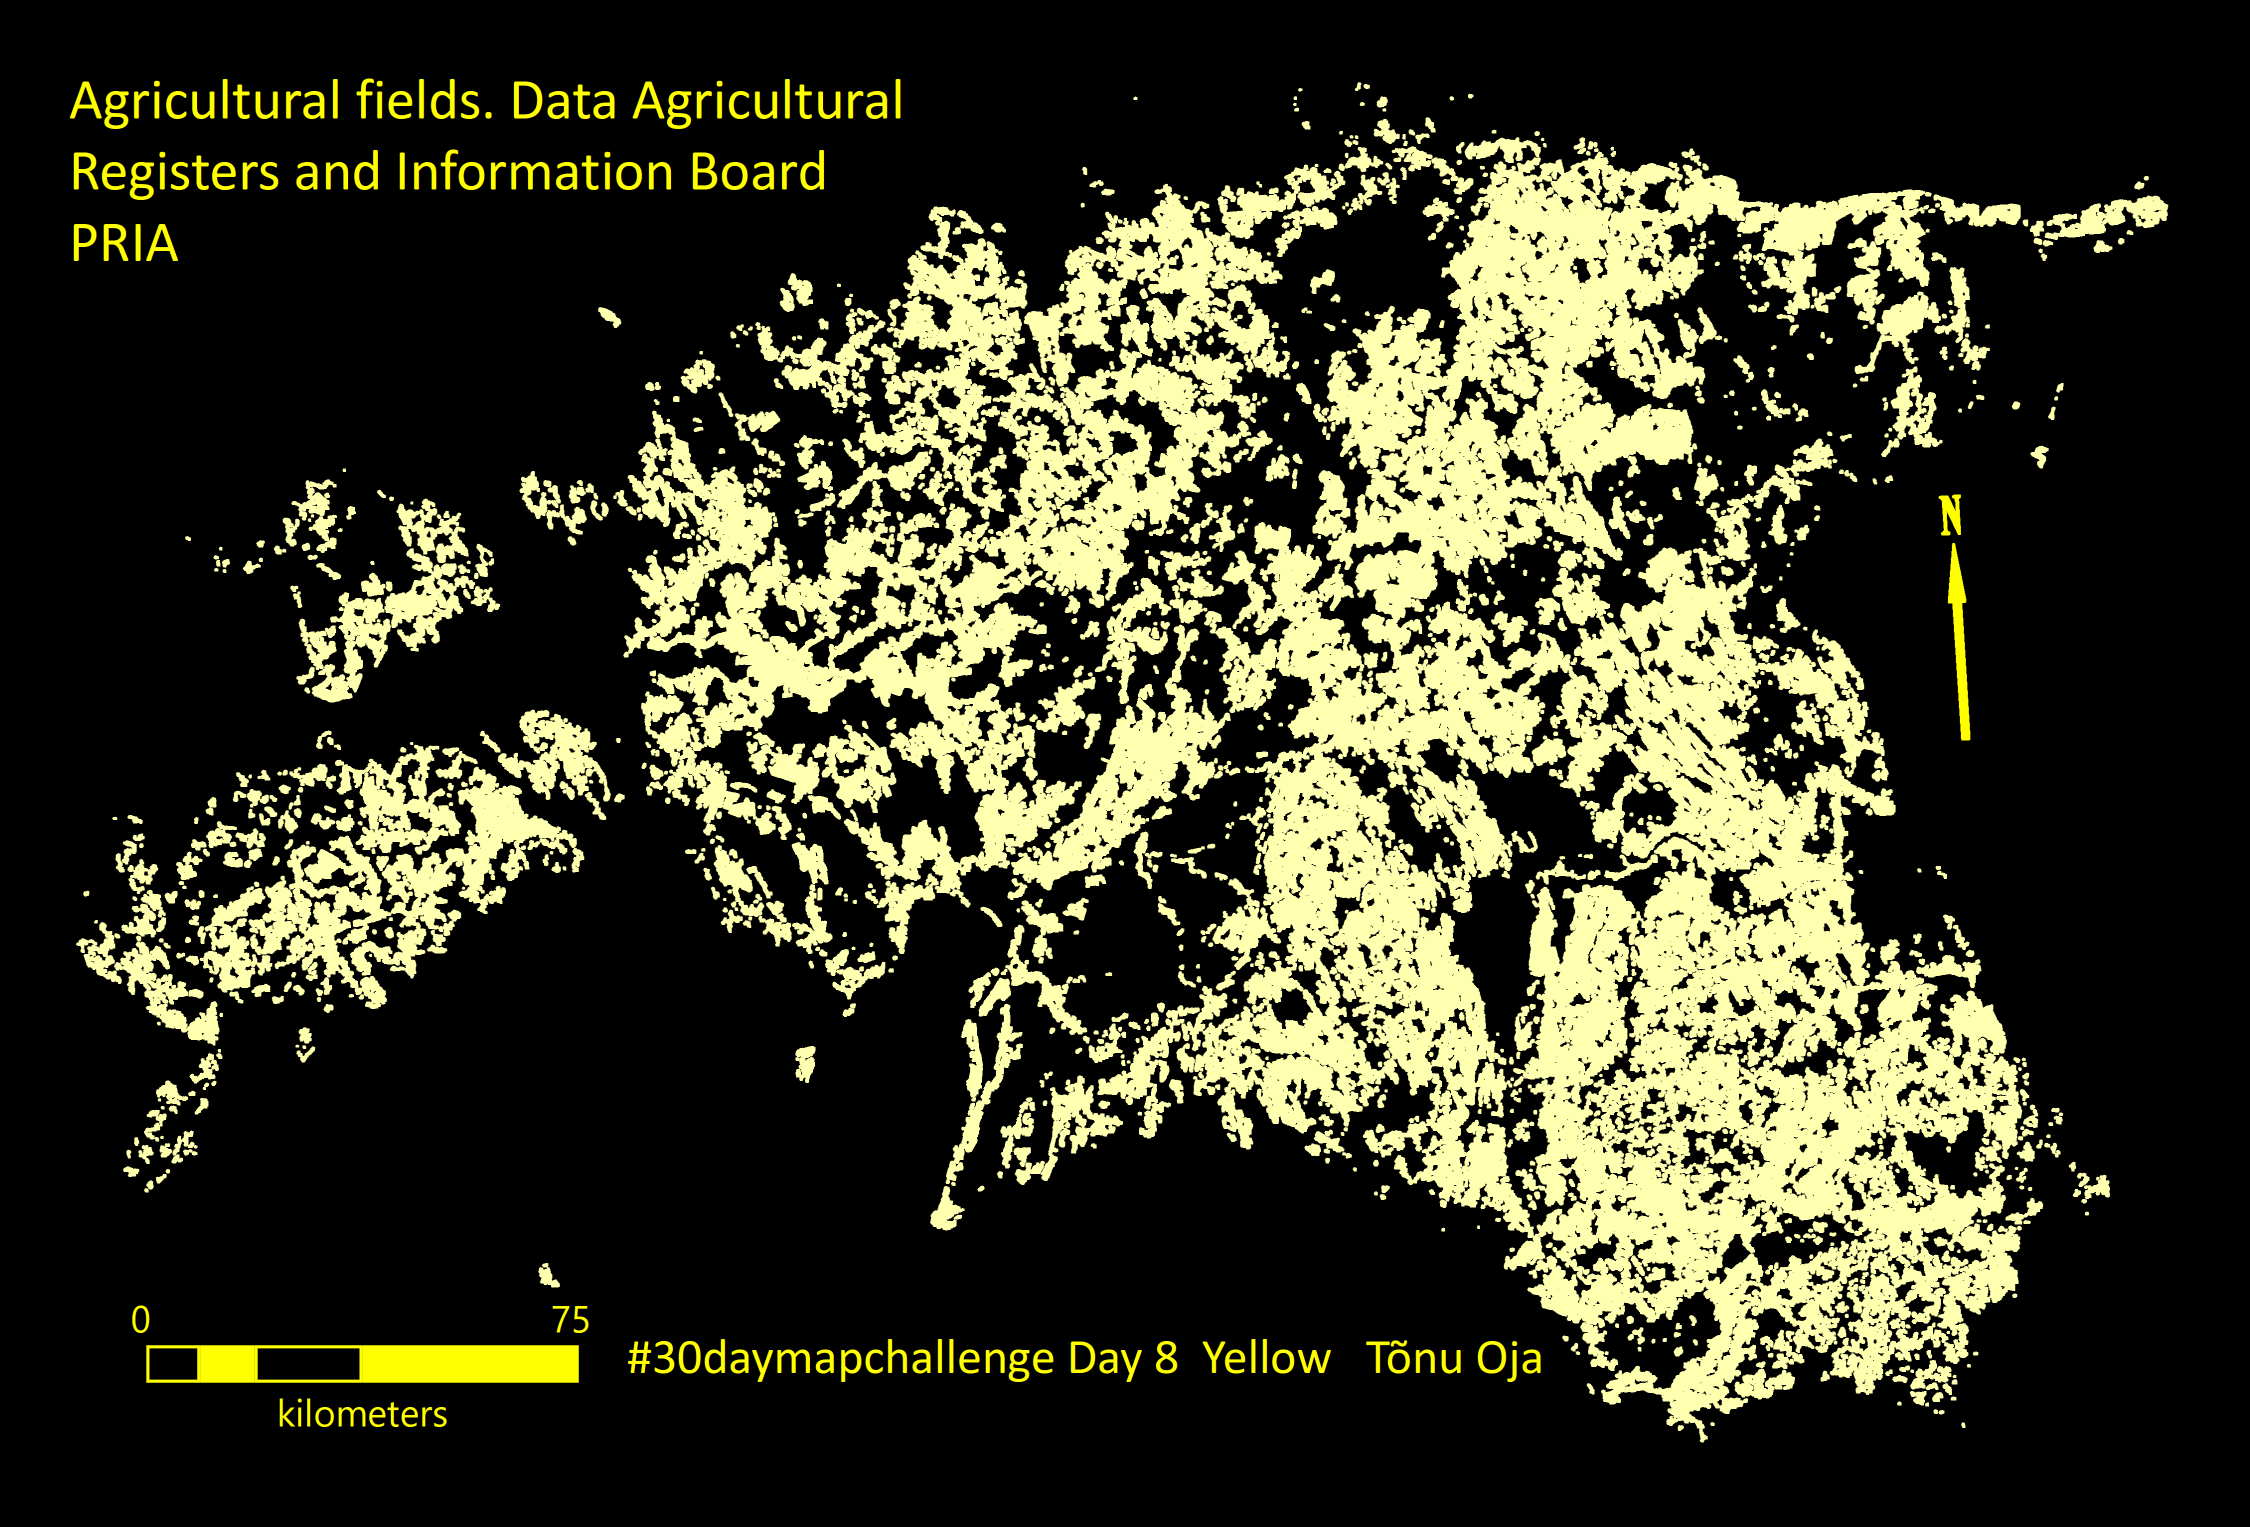
Agricultural fields in Estonia
Data: Agricultural Registers and Information Board. Map by Tõnu Oja.
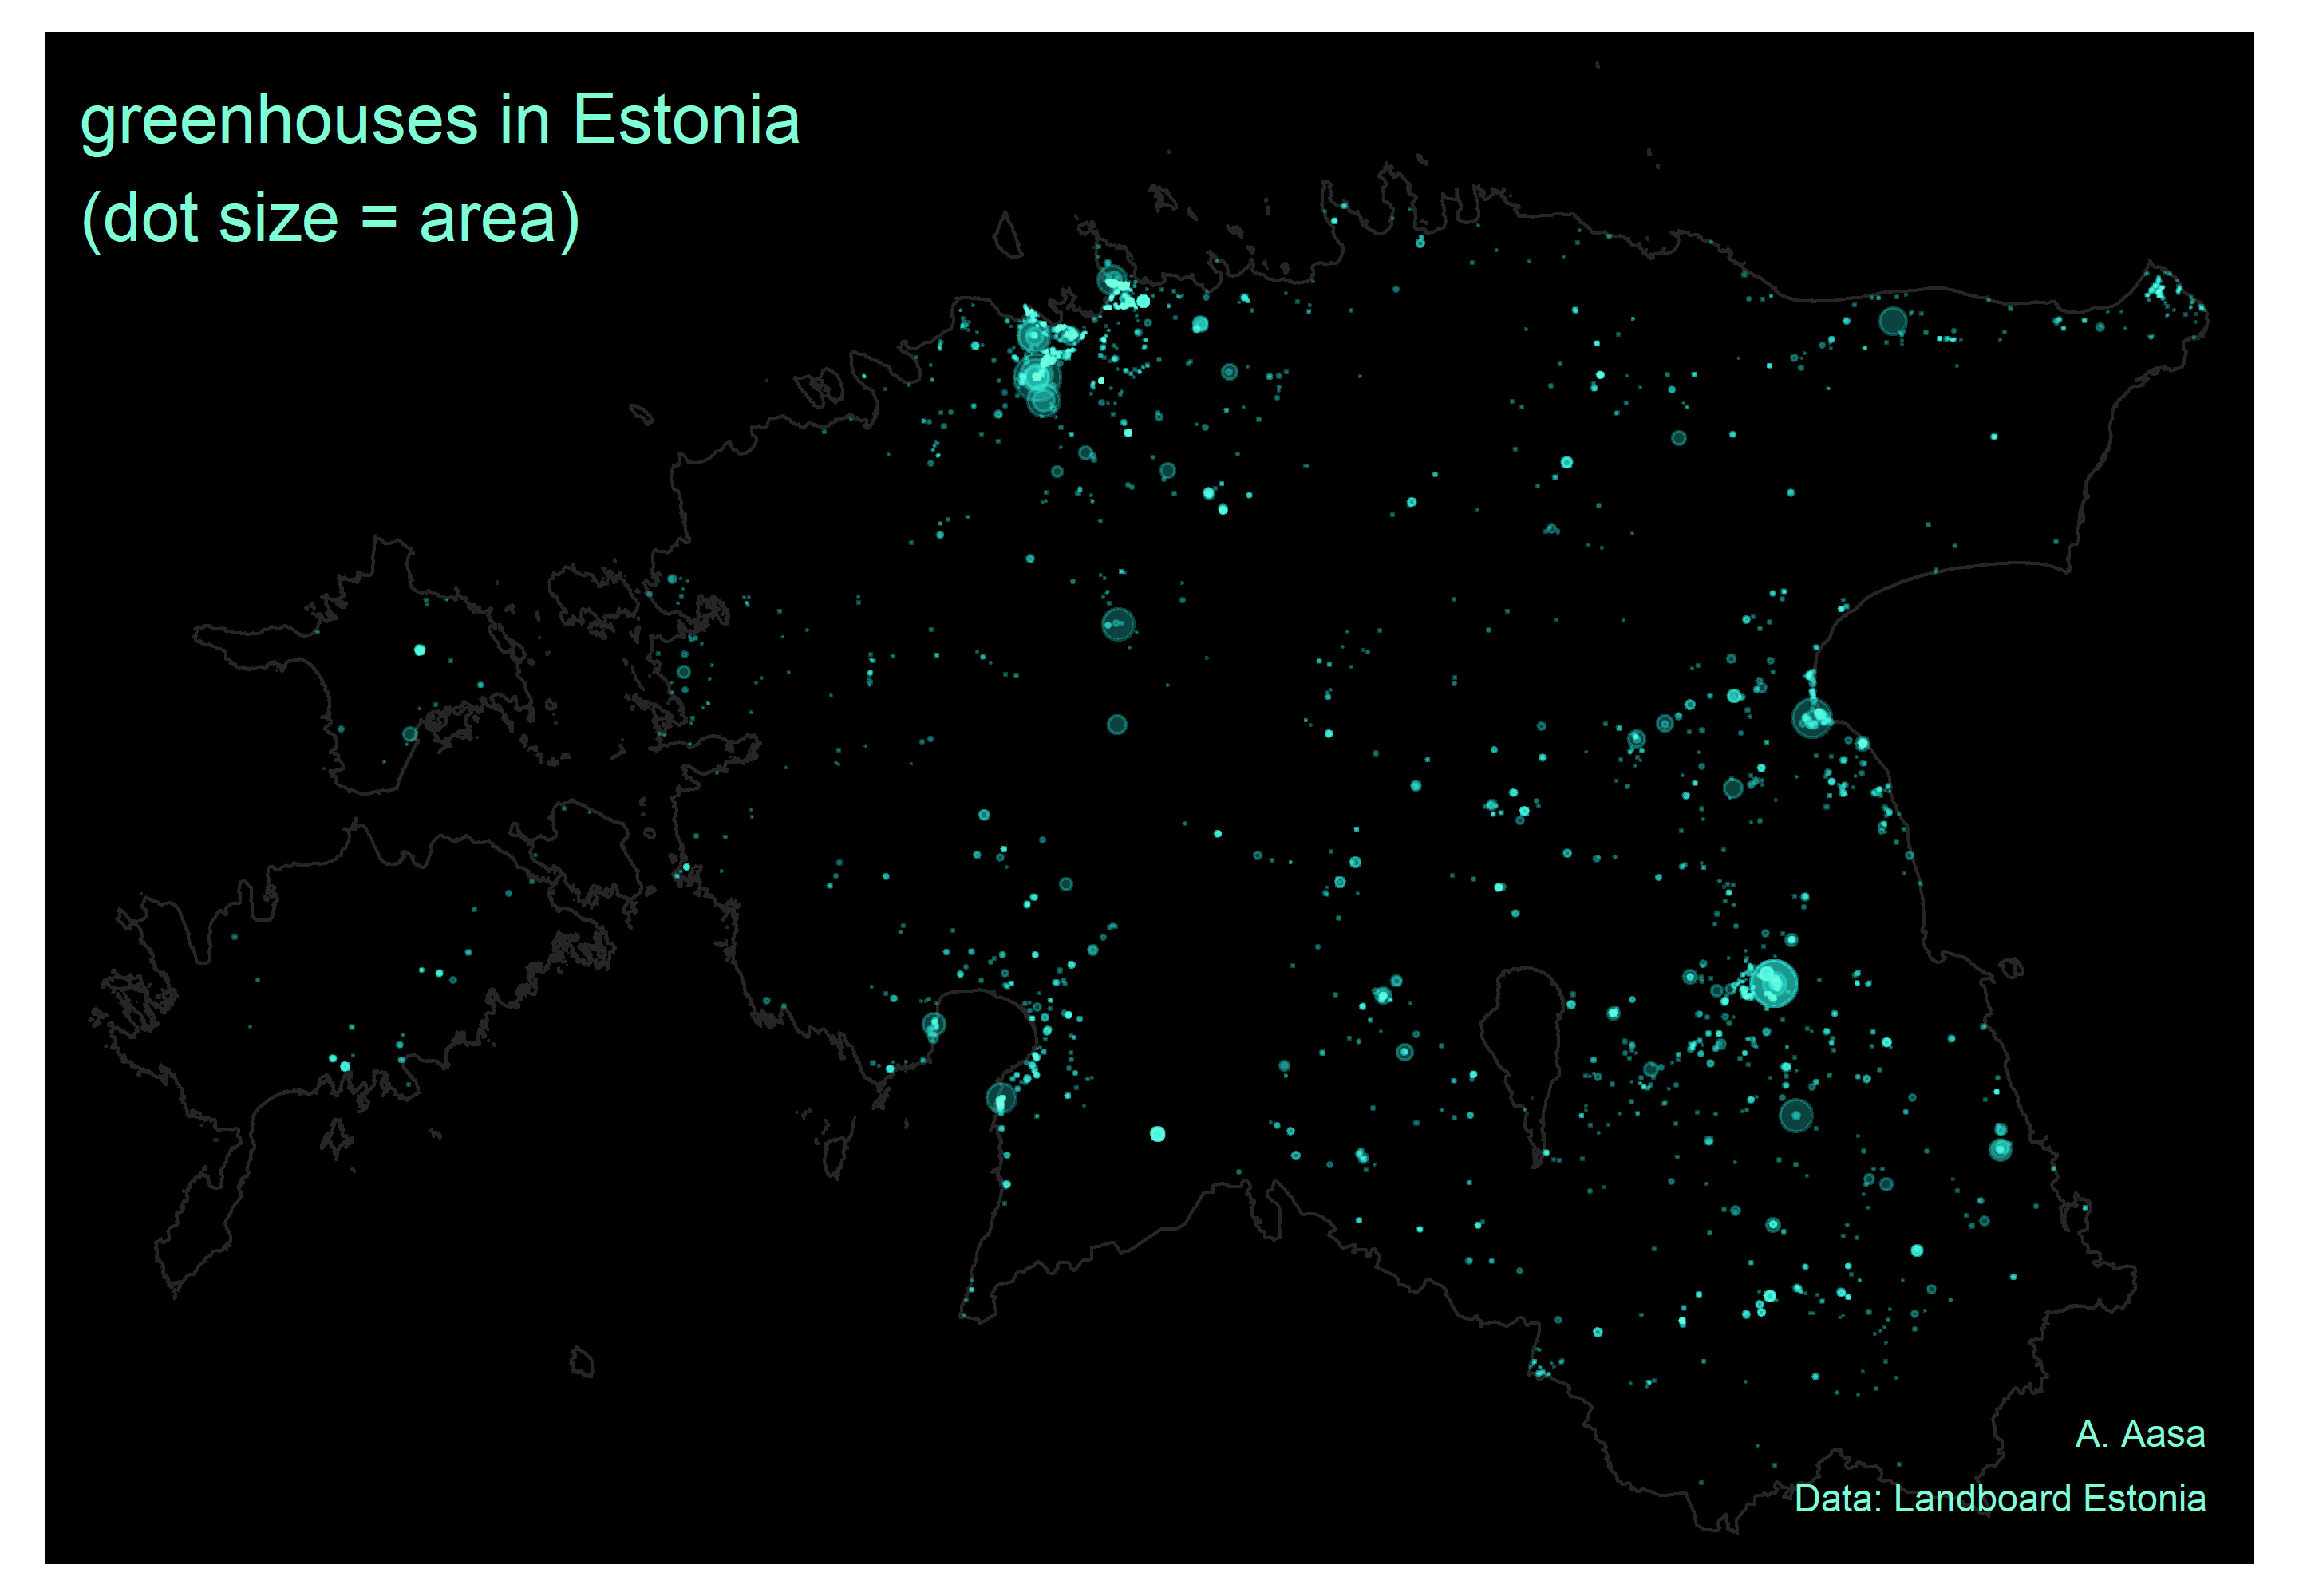
Greenhouses in Estonia
Data: Land Board, Estonian Topographic Database. Map by Anto Aasa.
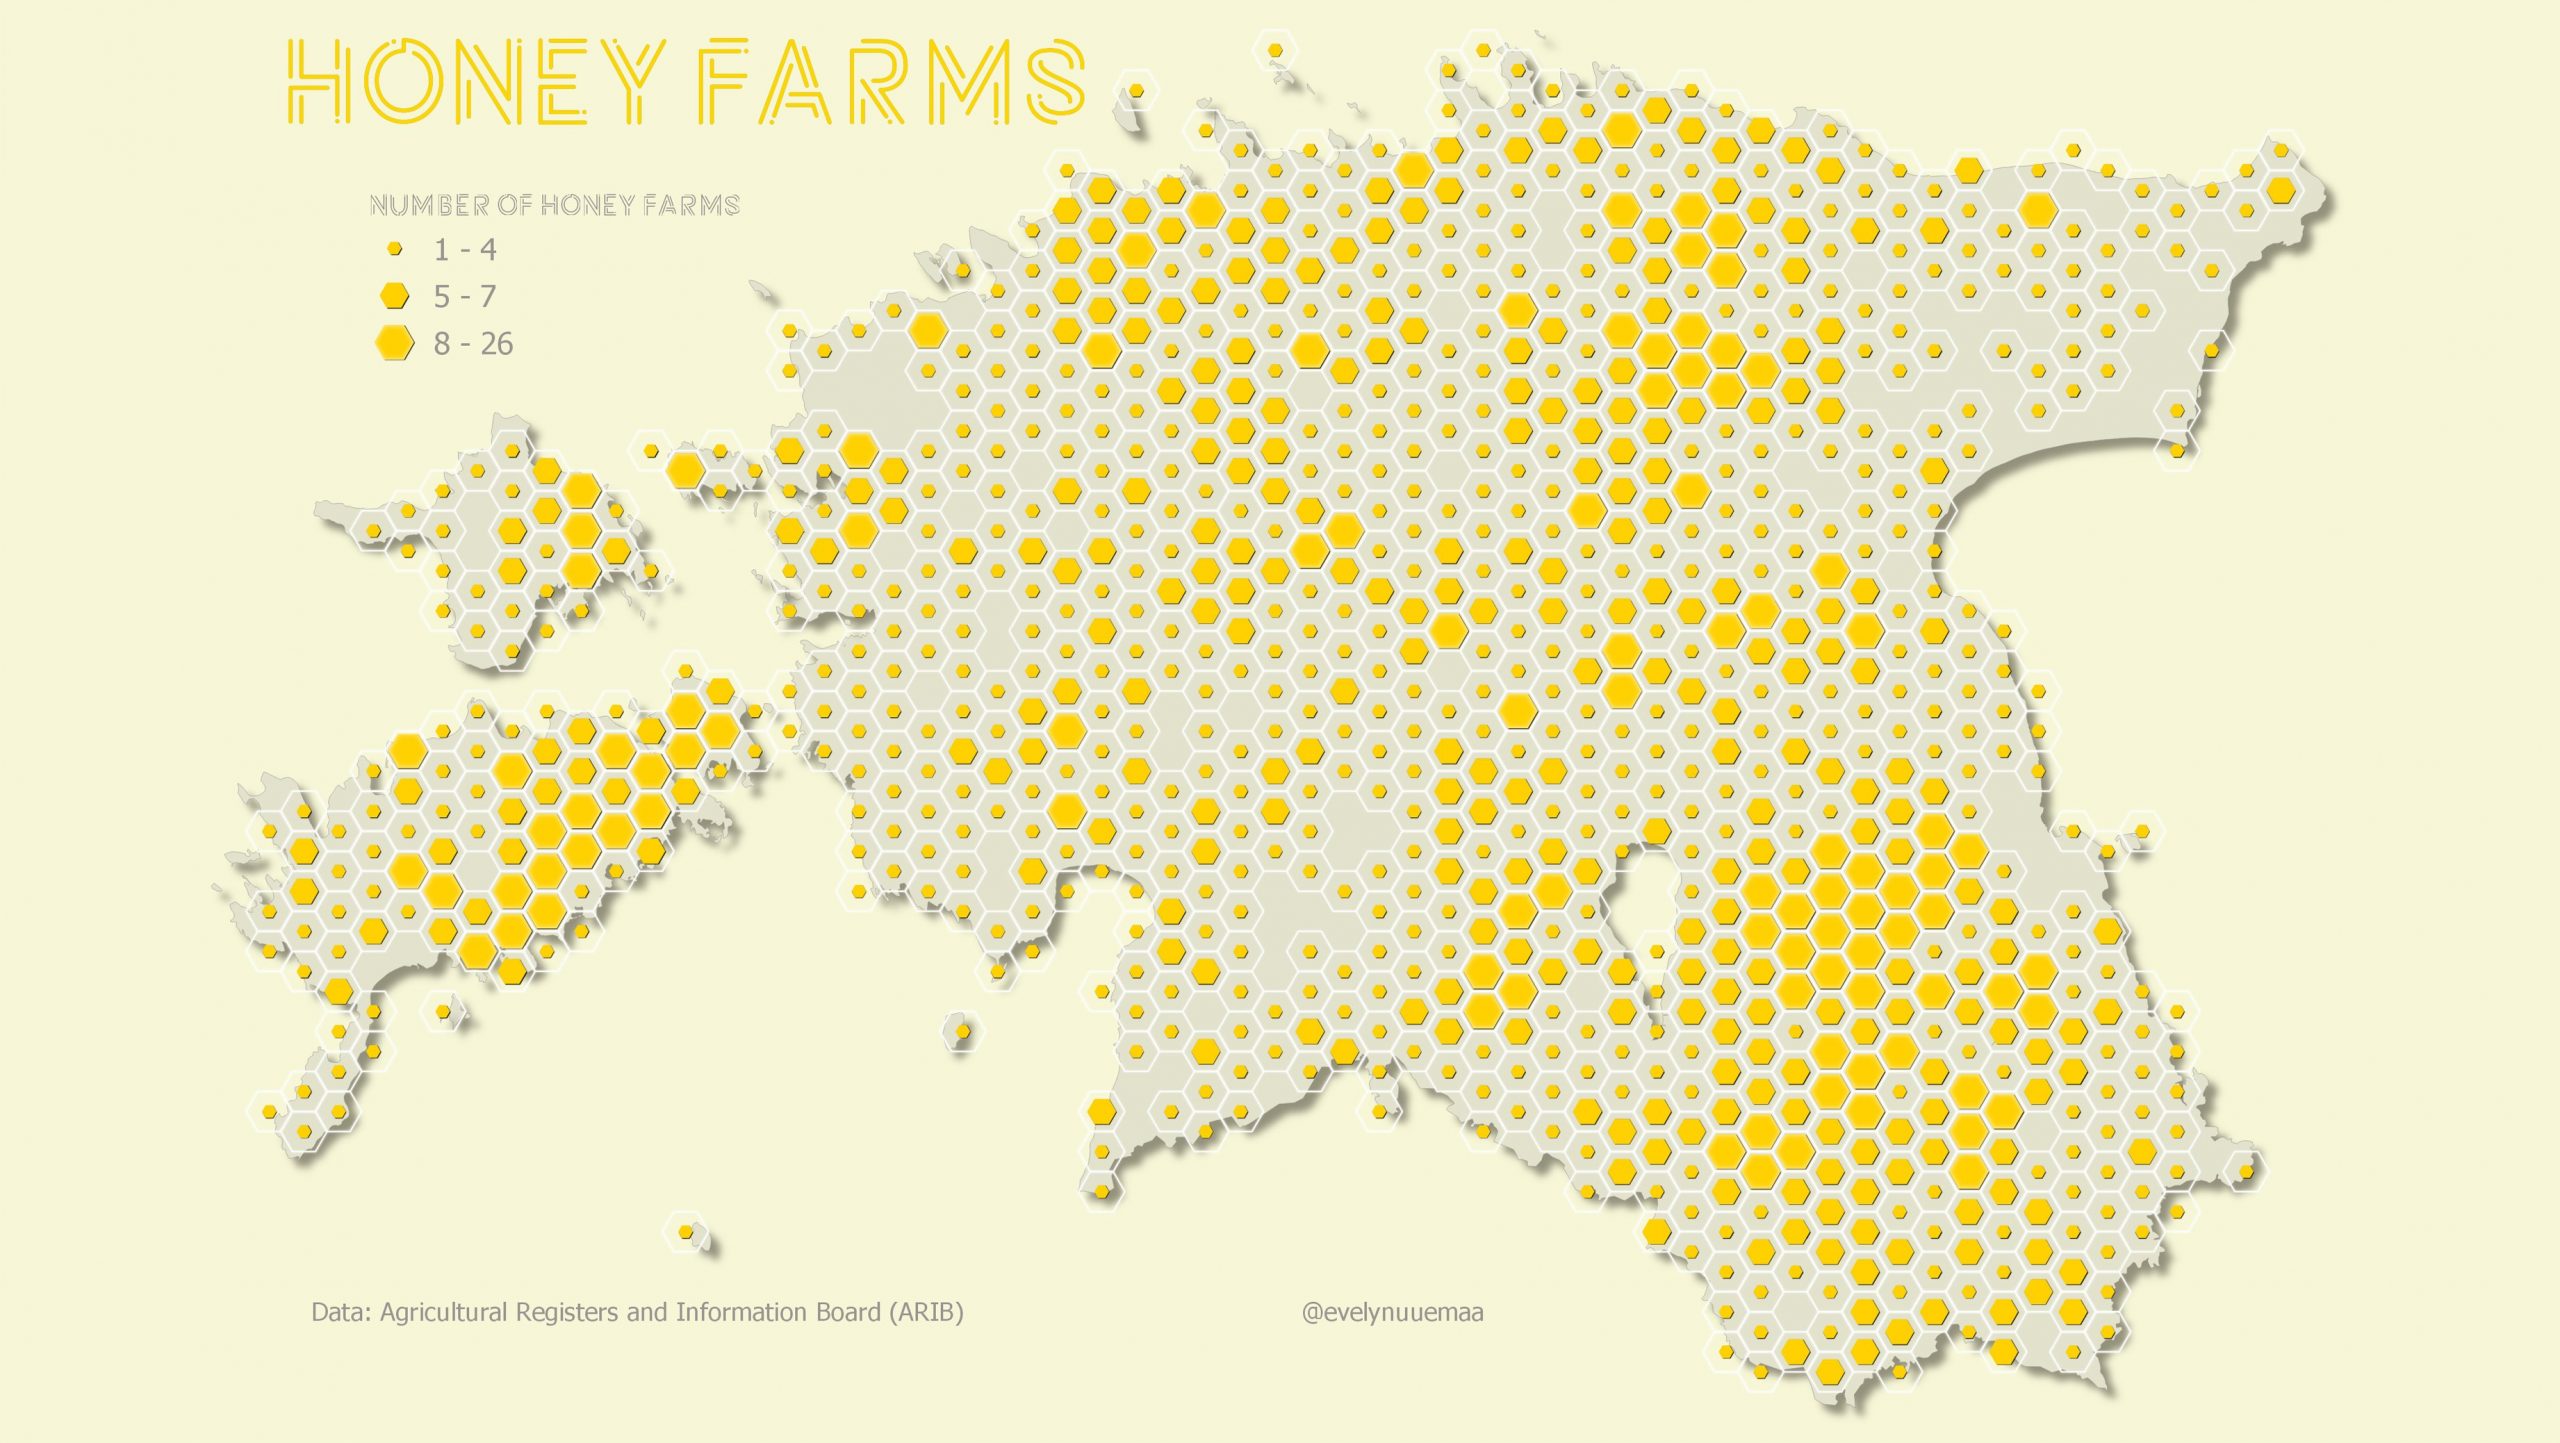
Honey farms in Estonia
Data: Agricultural Registers and Information Board. Map by Evelyn Uuemaa.
Dialects in Estonia
The three most widely spoken dialects in Estonia – Võru, Saare, and Mulgi – are mapped as dots. One dot marks one person speaking the dialect at a random location in the respective territorial unit according to the 2011 census. Data: Estonian Statistics. Map by Evelyn Uuemaa.
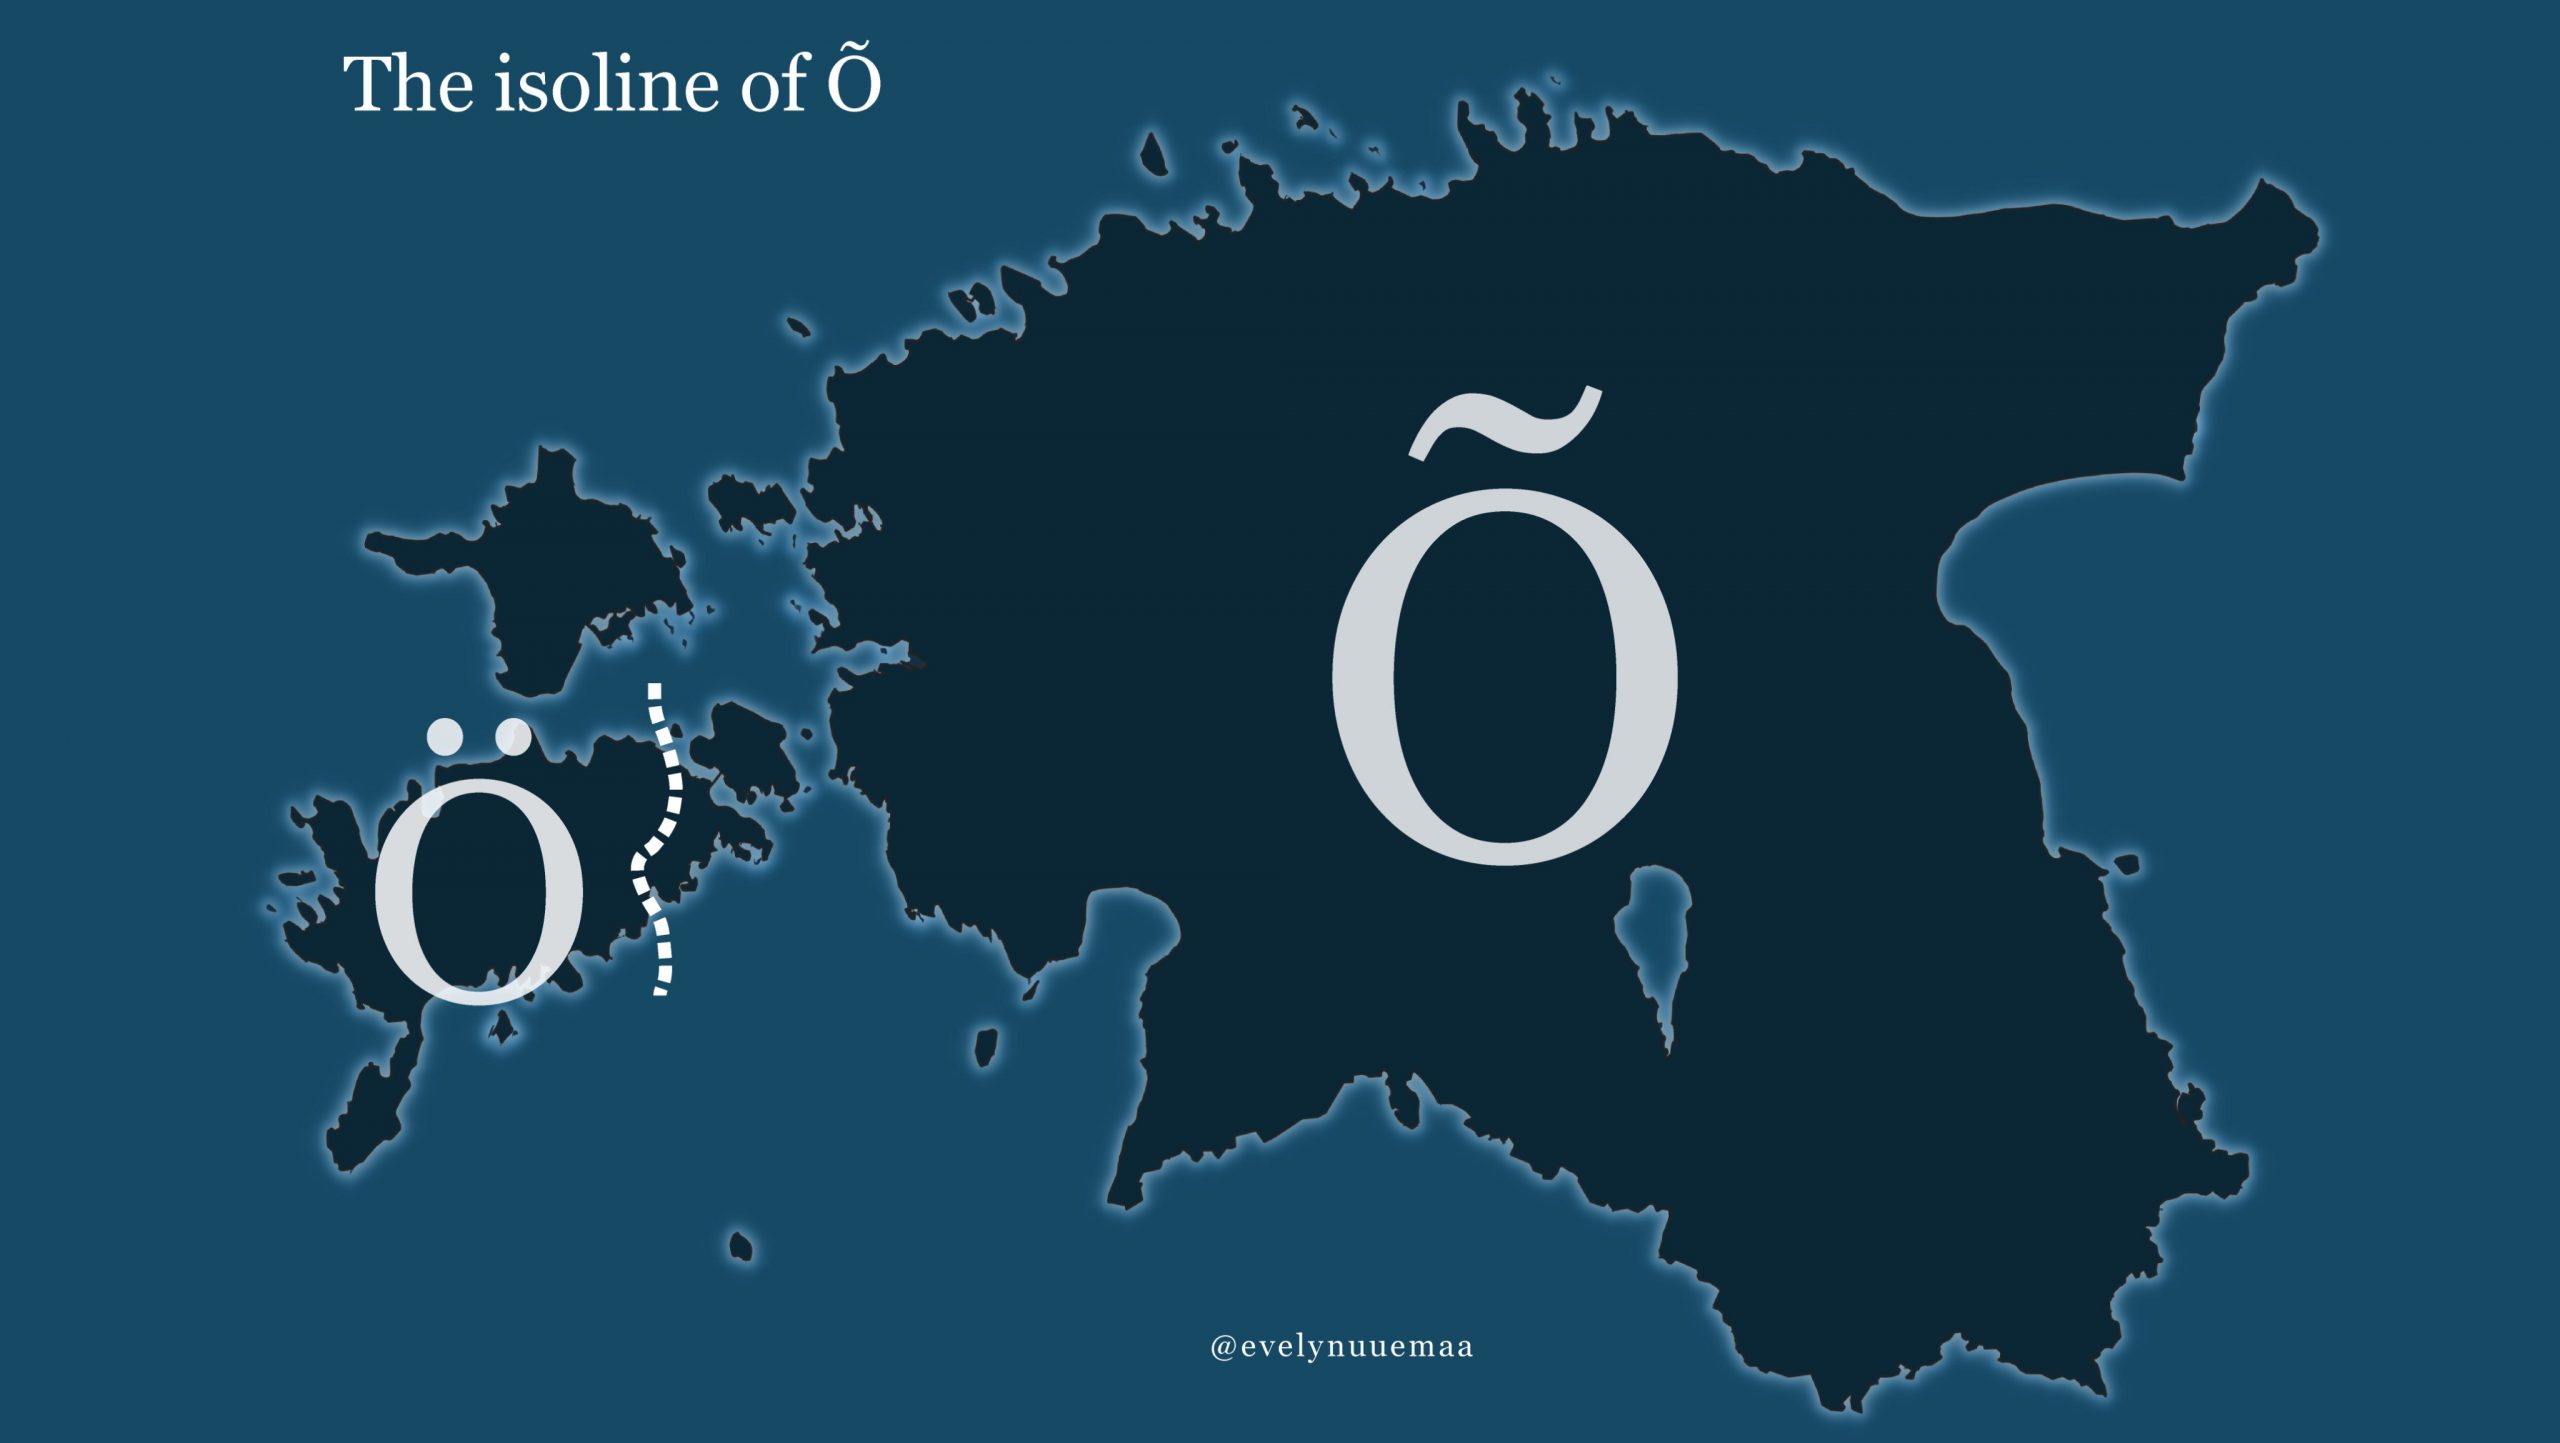
The isoline of Õ
One of the coolest peculiarities in the Saaremaa dialect is that instead of the Estonian vowel ‘Õ’, they use ‘Ö’. The isoline marks the line where the change in the vowel is found. Historically, it was mapped by Theodor Kaljo in the 1920s. Map by Evelyn Uuemaa.
Place names containing “saar” (“island” in Estonian)
Data: Land Board, address data. Map by Anto Aasa.
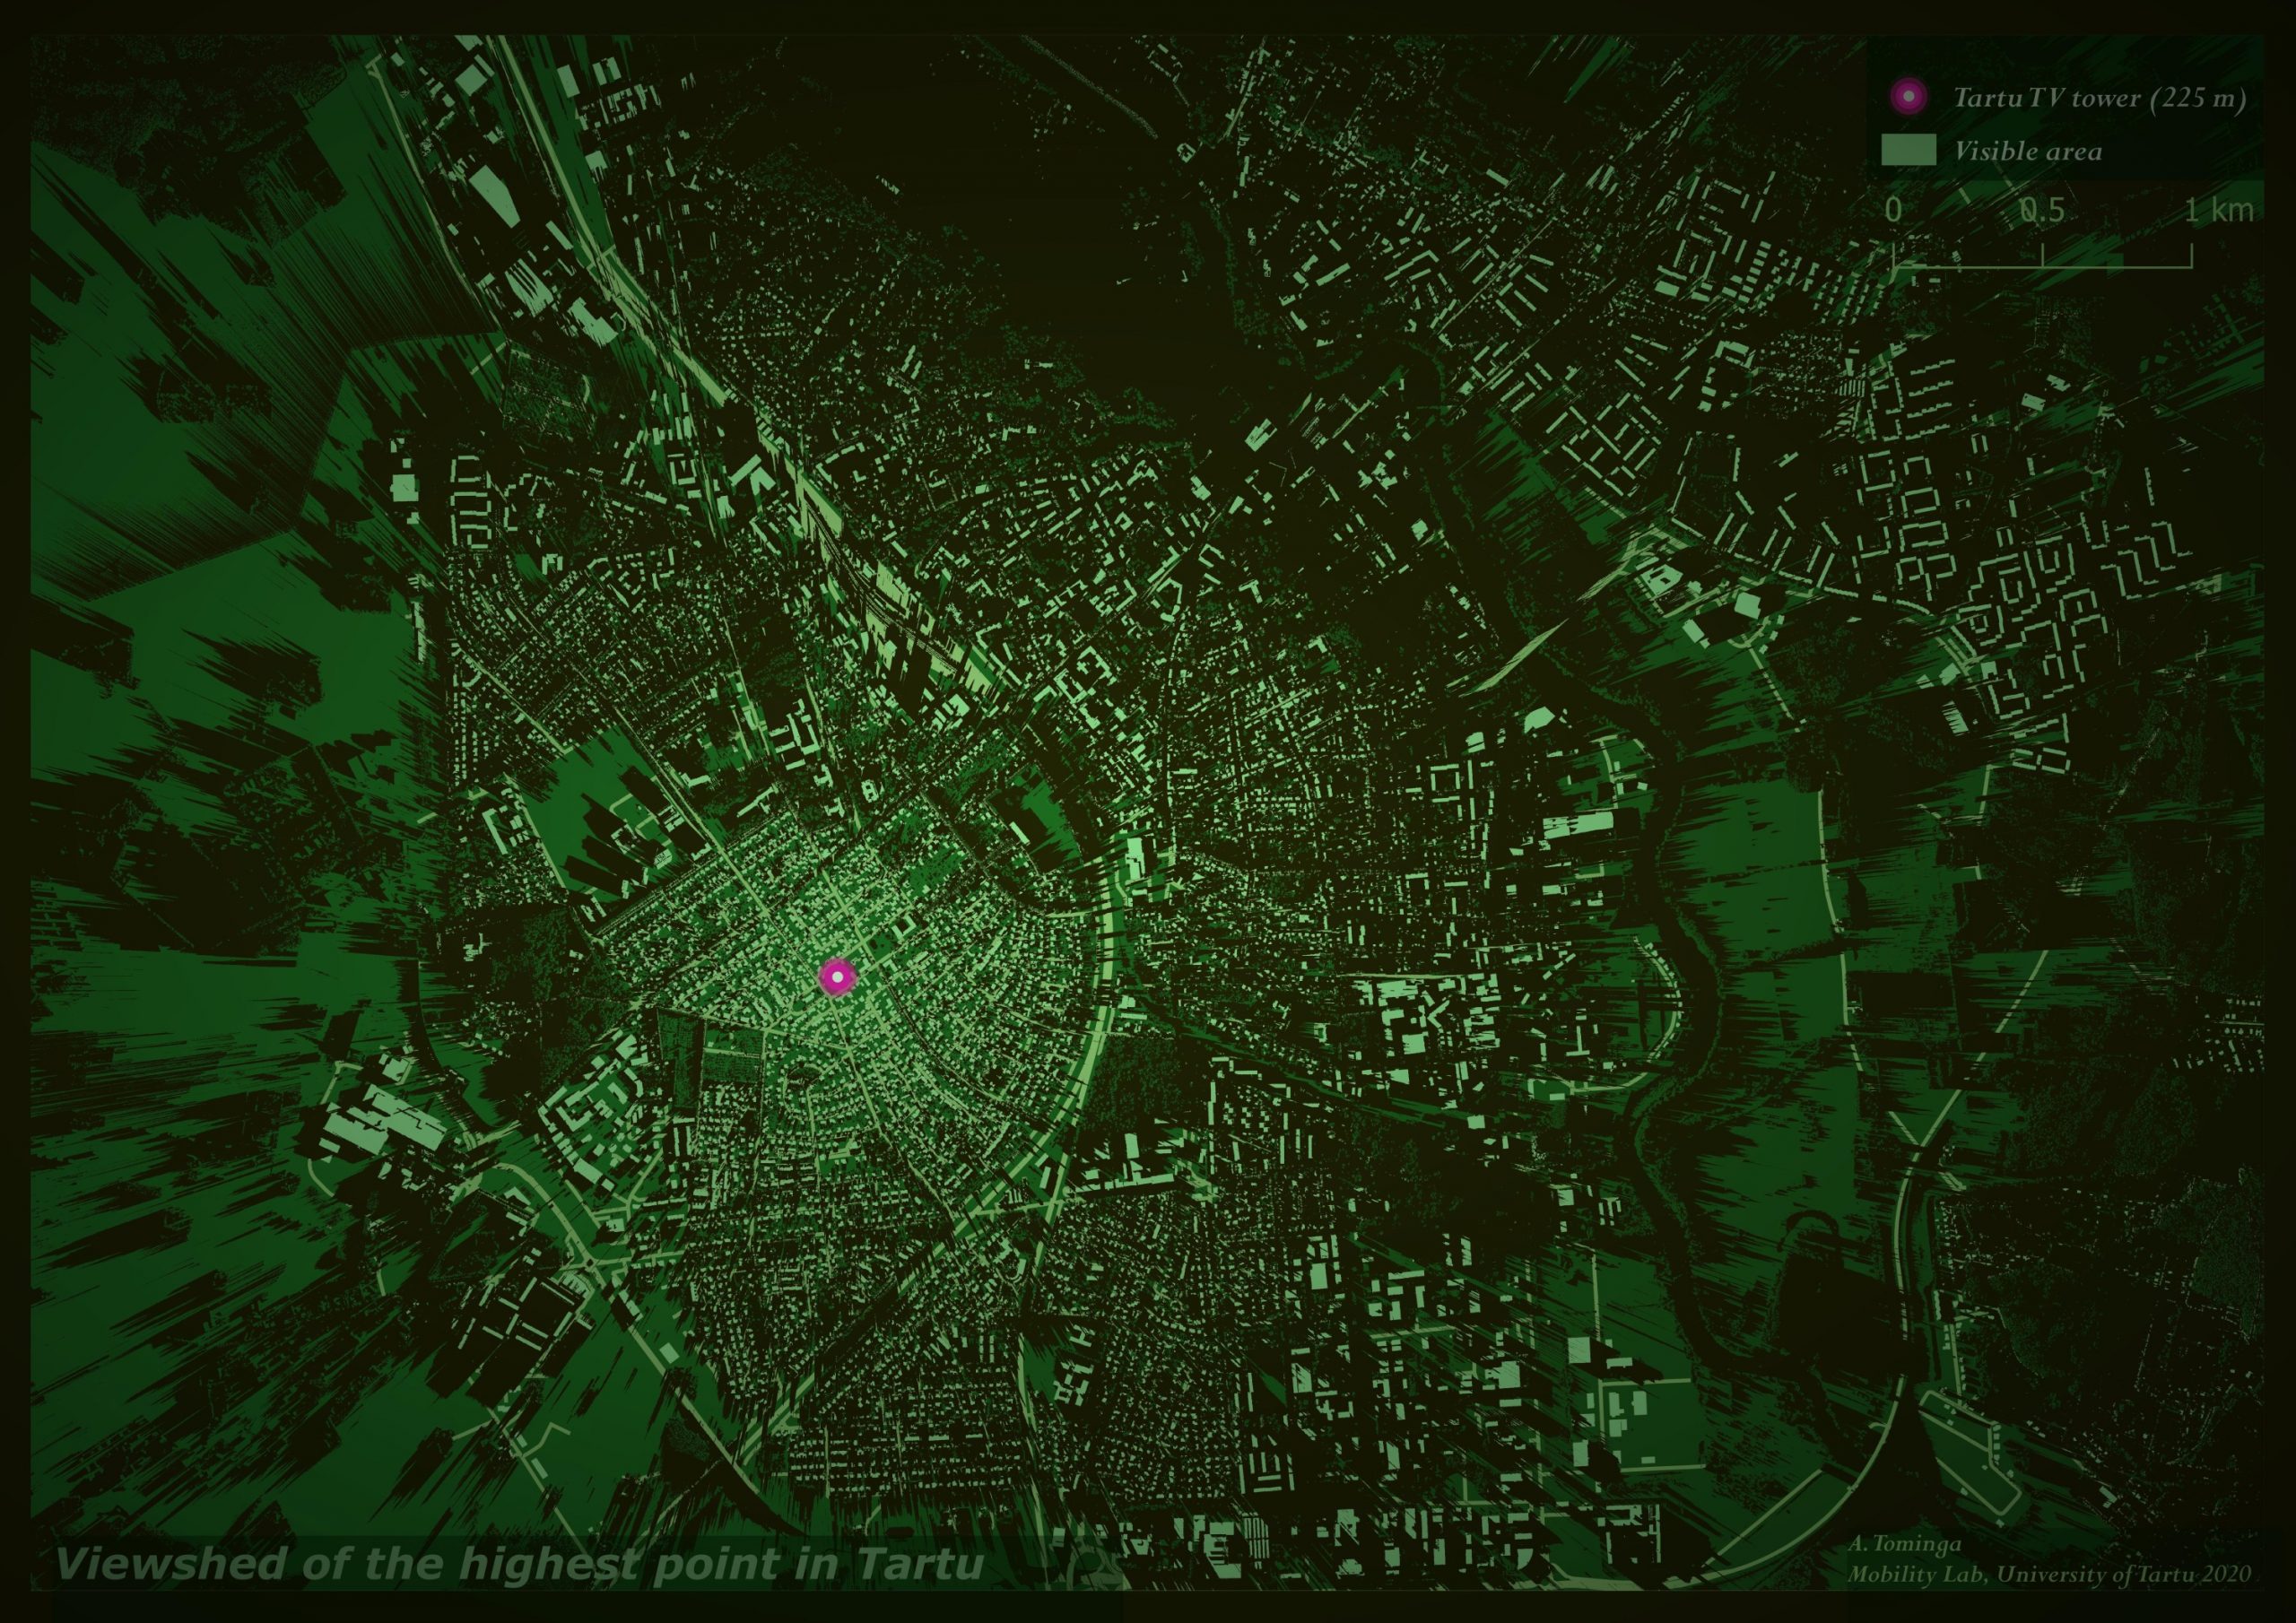
Viewshed of the highest point in Tartu
Green shades indicate areas from which you should theoretically, under perfect weather conditions, be able to see the tip of the Tartu TV tower. Data: Landboard of Estonia. Map by Ago Tominga / UT Mobility Lab.
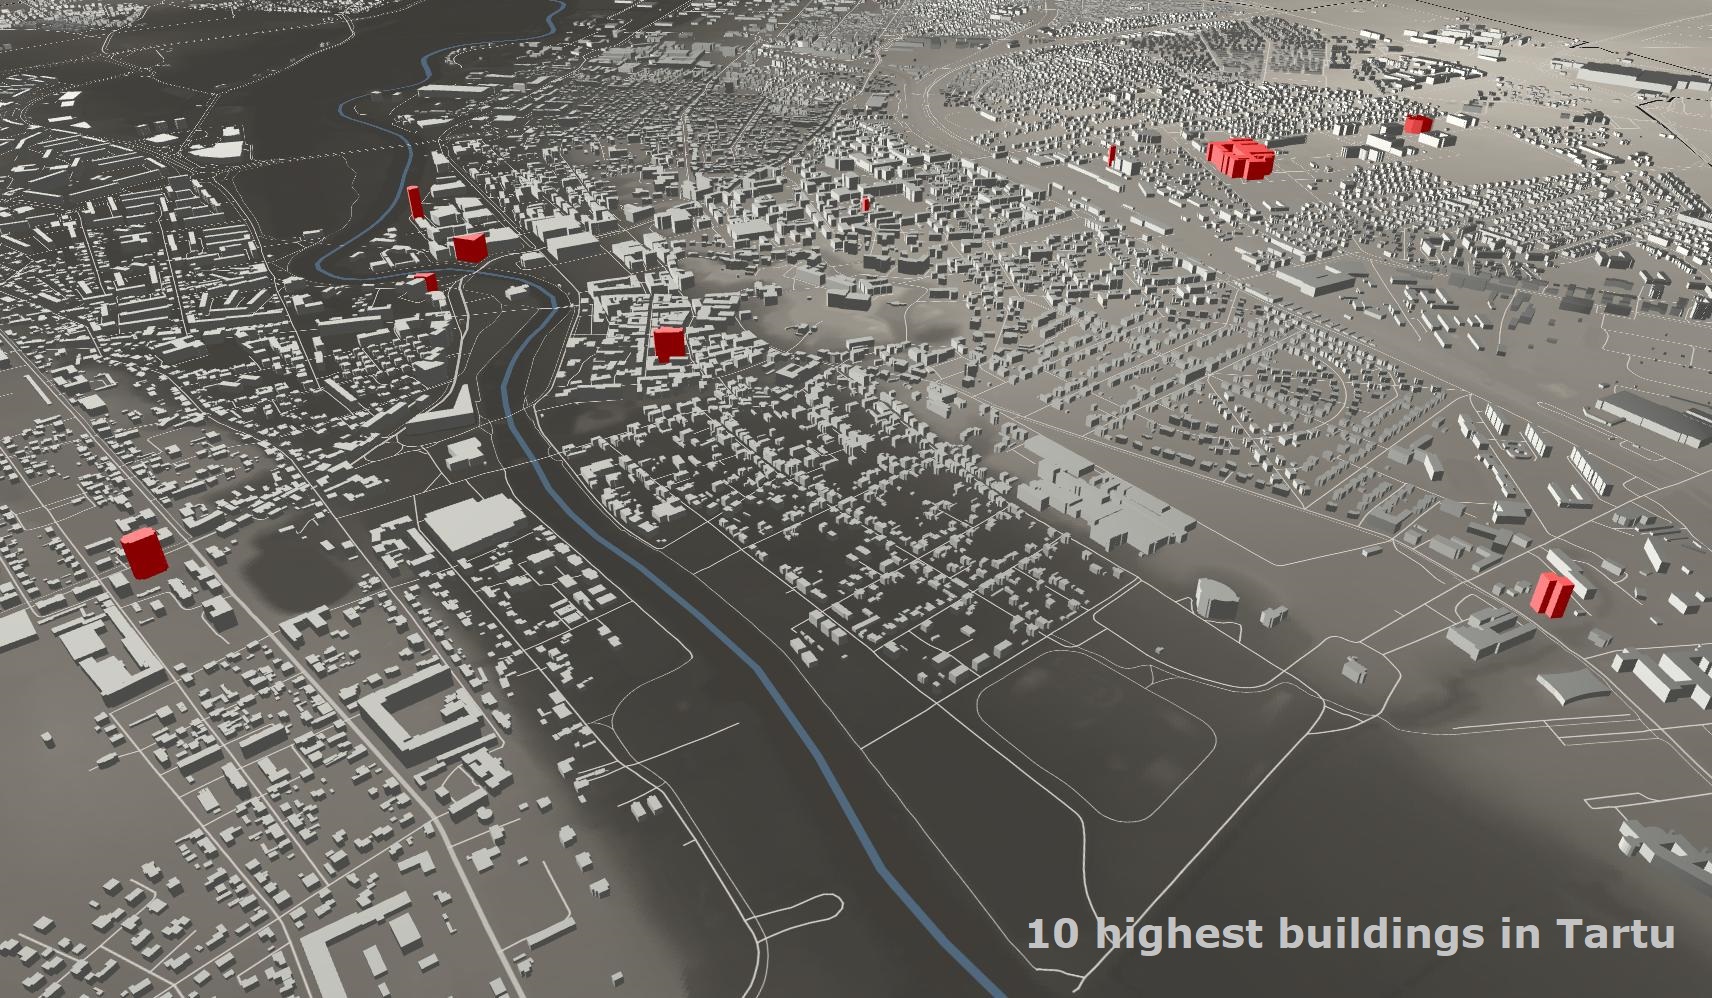
Highrisers in Tartu
Data: Landboard of Estonia. Map by Ago Tominga / UT Mobility Lab.
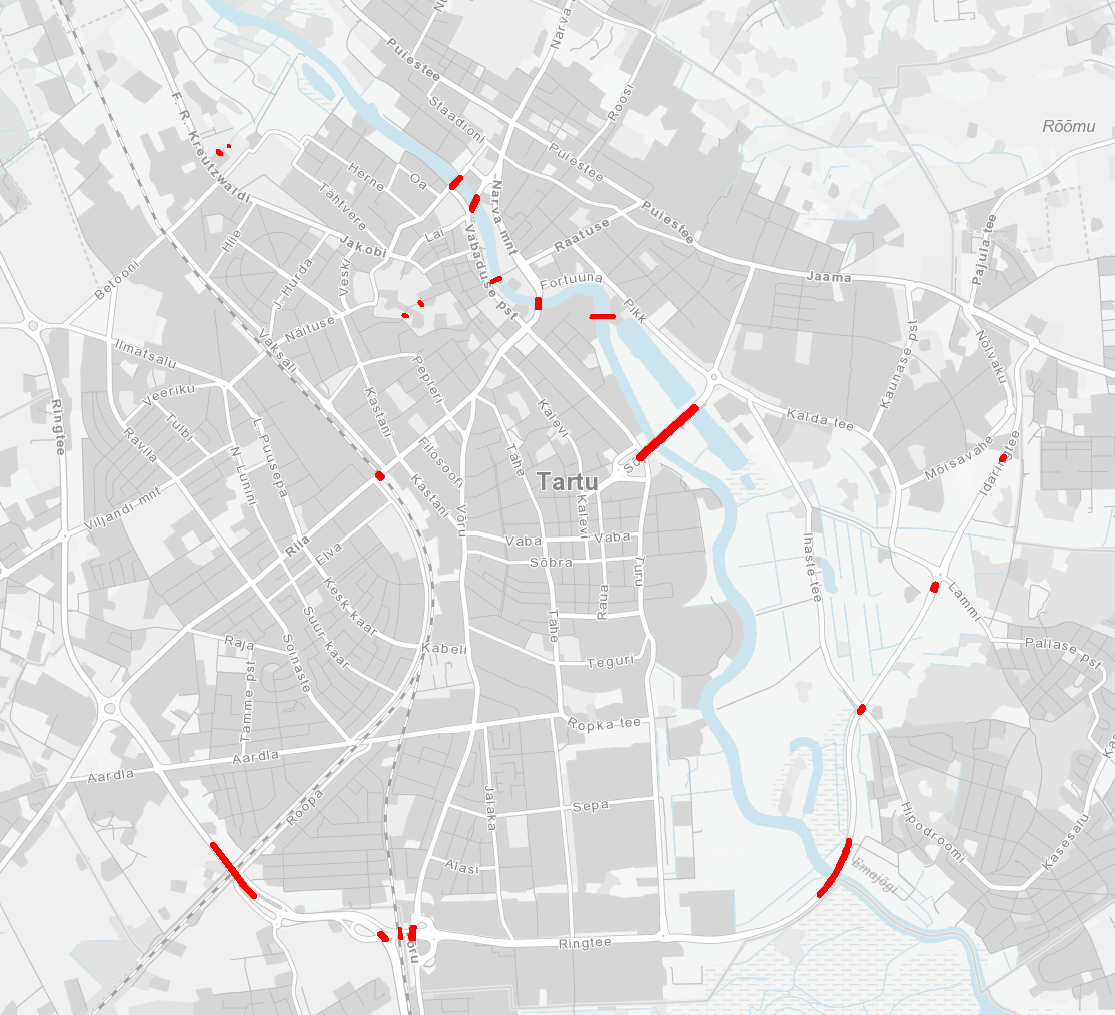
Bridges in Tartu
Data: Land Board, Estonian Topographic Database. Map by Anto Aasa.
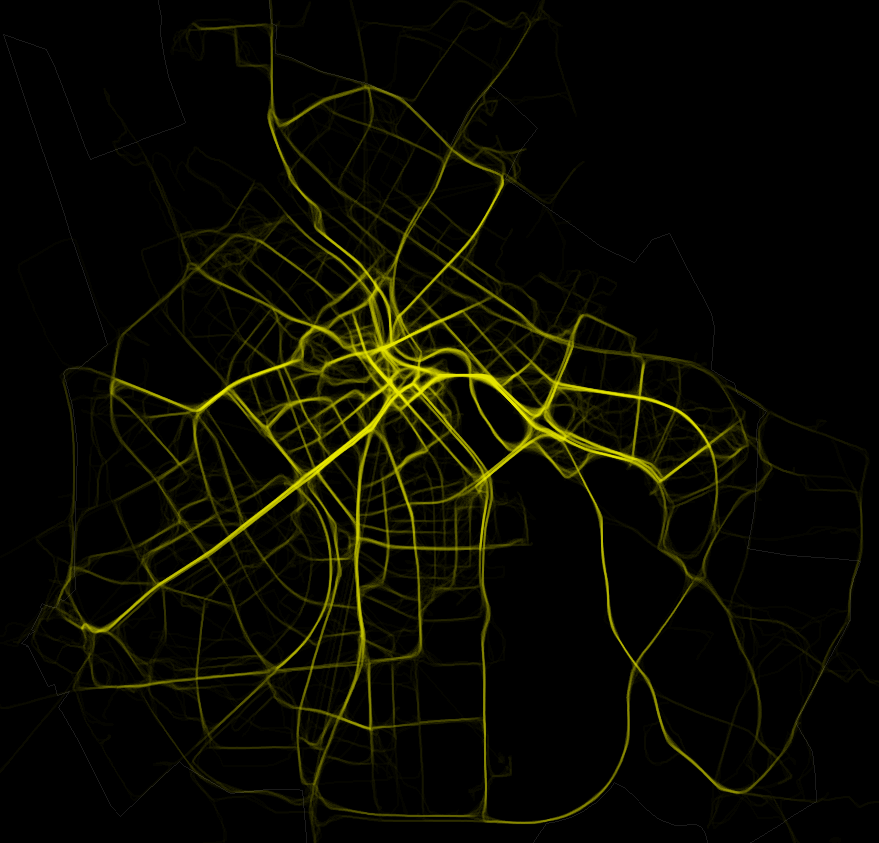
Movement of people in Tartu
The map is based on GPS tracking. Map by Anto Aasa / UT Mobility Lab.
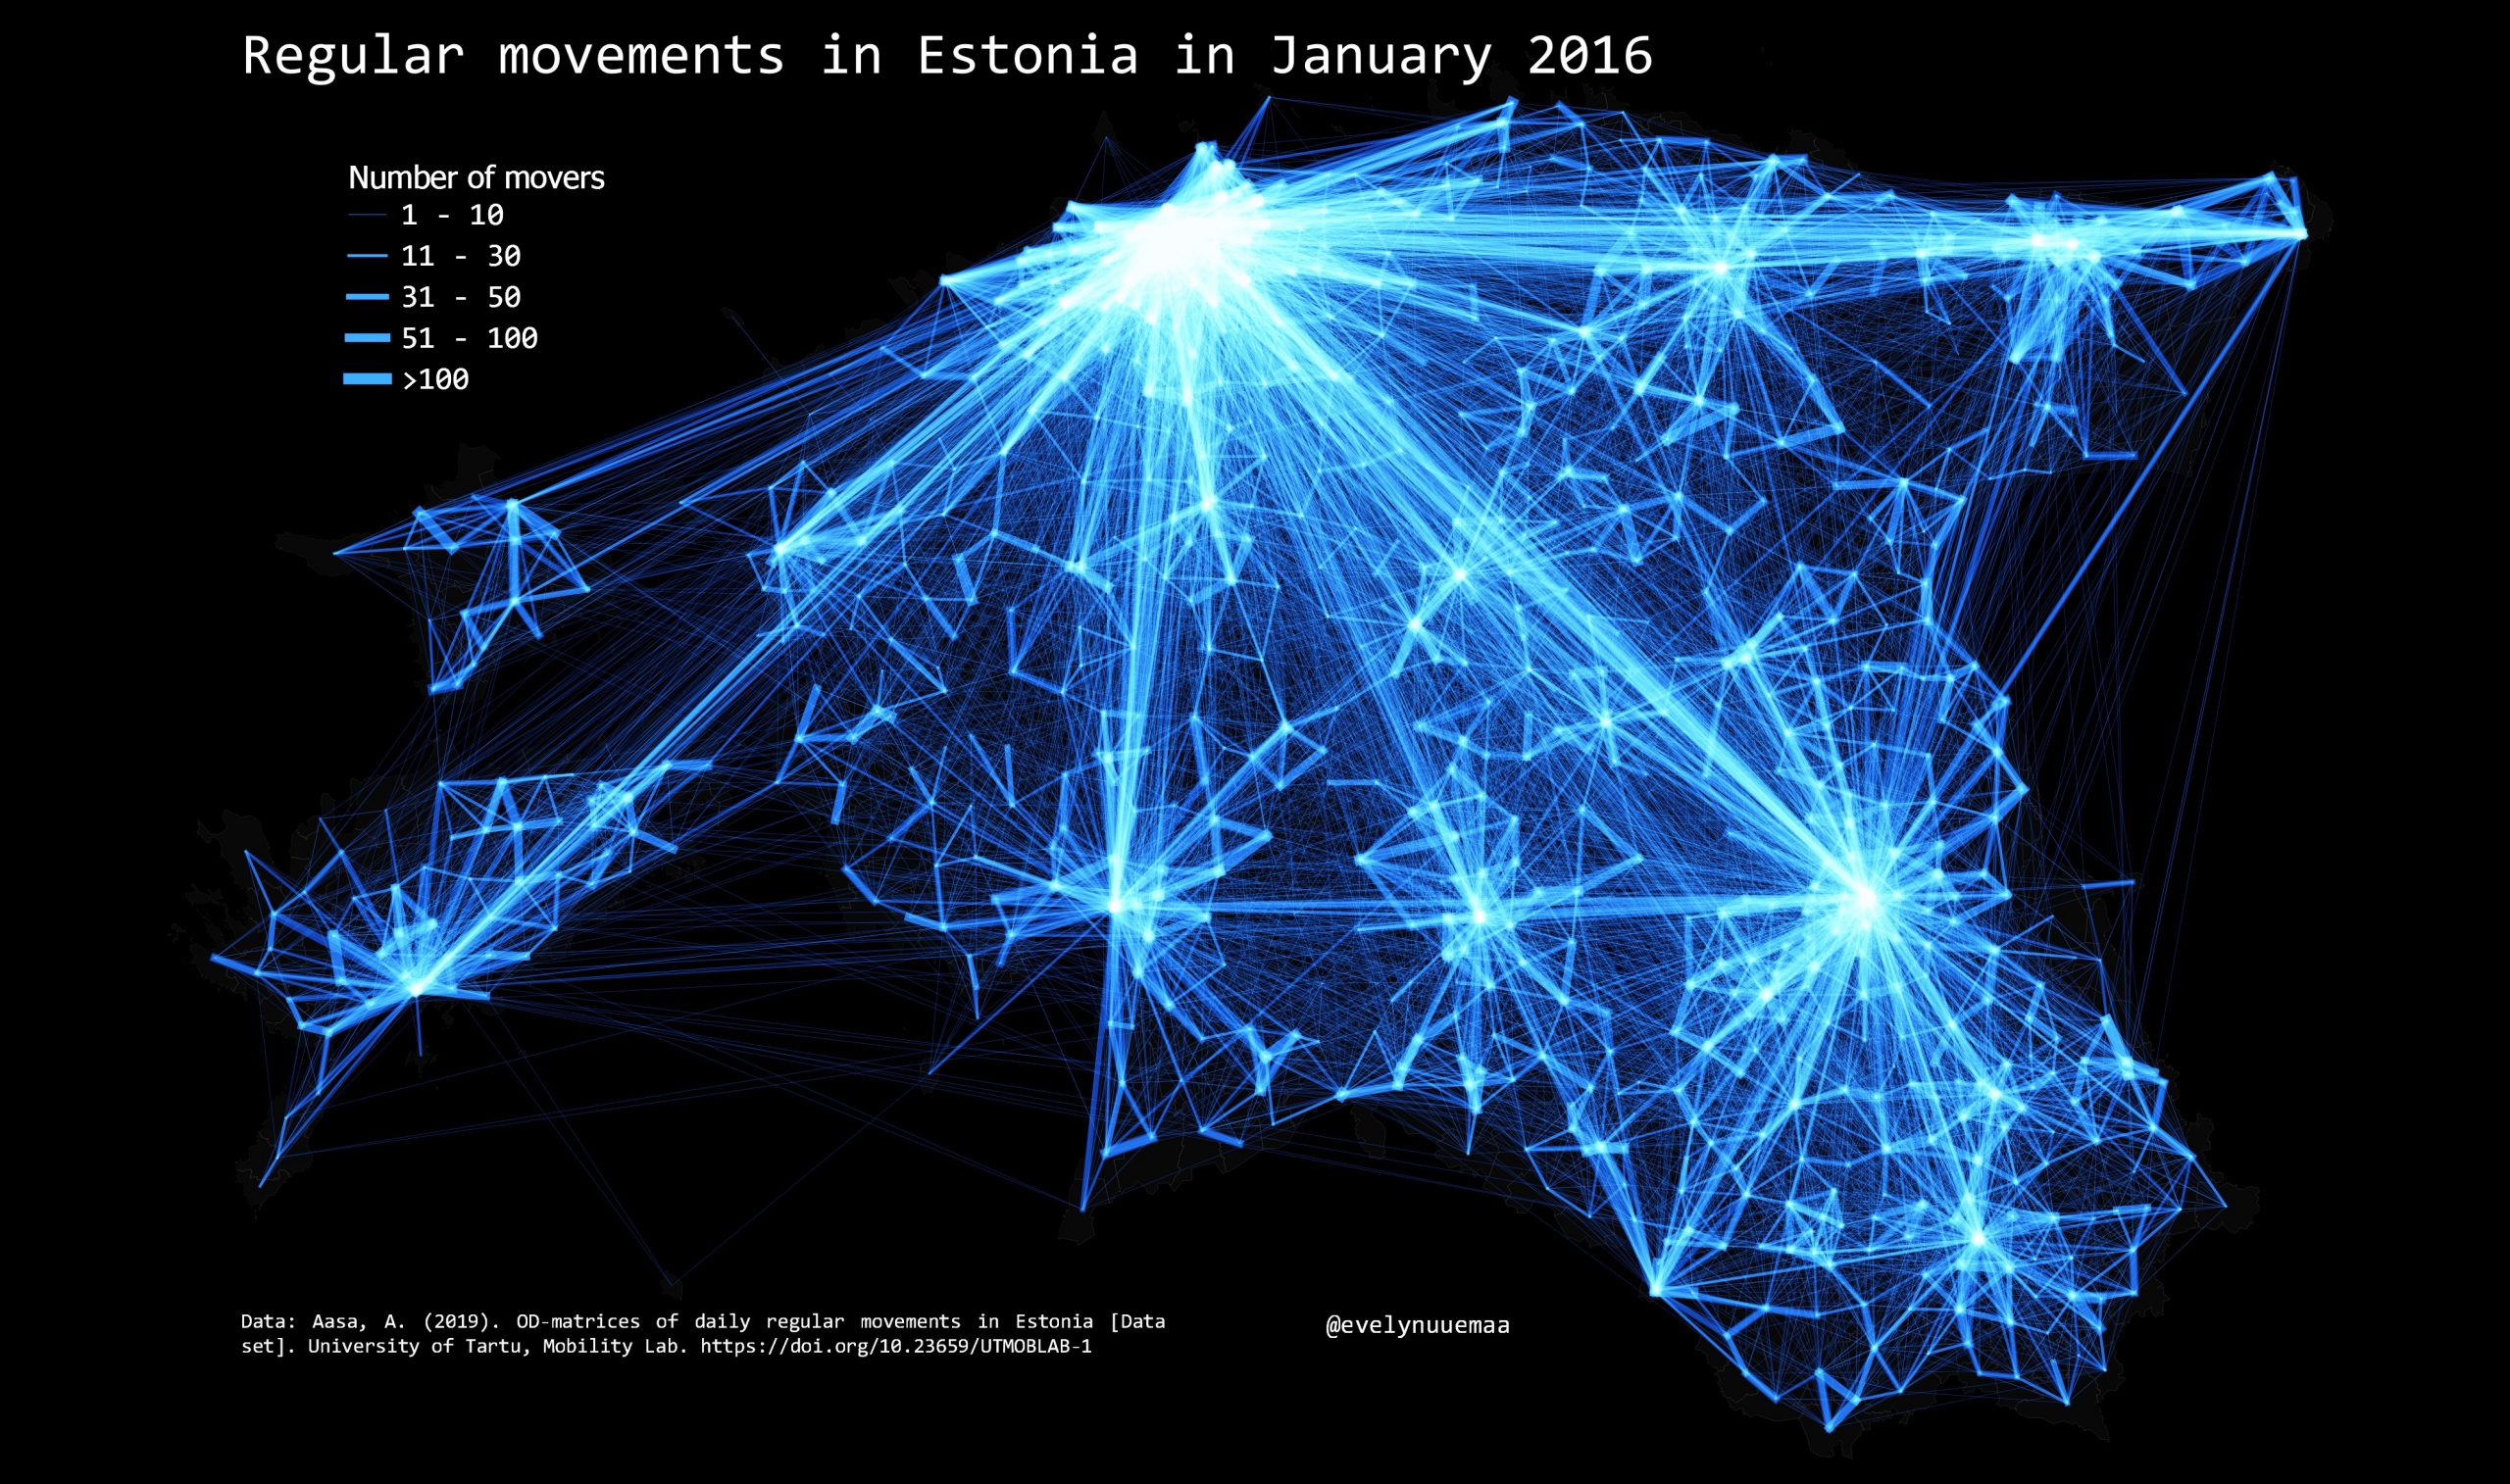
Regular movements in Estonia
Map by Evelyn Uuemaa. Data: Anto Aasa / UT Mobility Lab.
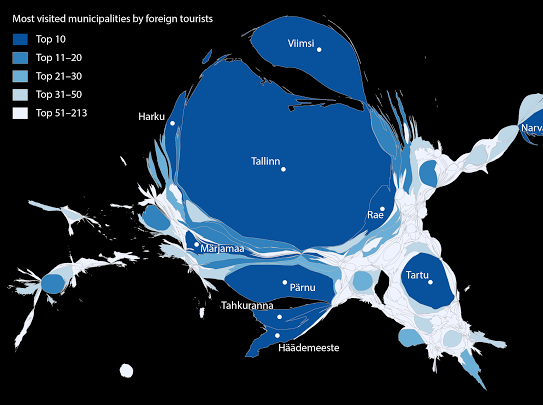
Most visited Estonian municipalities by foreign tourists
Most visited Estonian municipalities by foreign tourists in 2016, calculated from mobile phone data. The size of each municipality is distorted in proportion to the number of visits it welcomed. Data: Mobile Positioning Data. Map by Janika Raun / UT Mobility Lab.
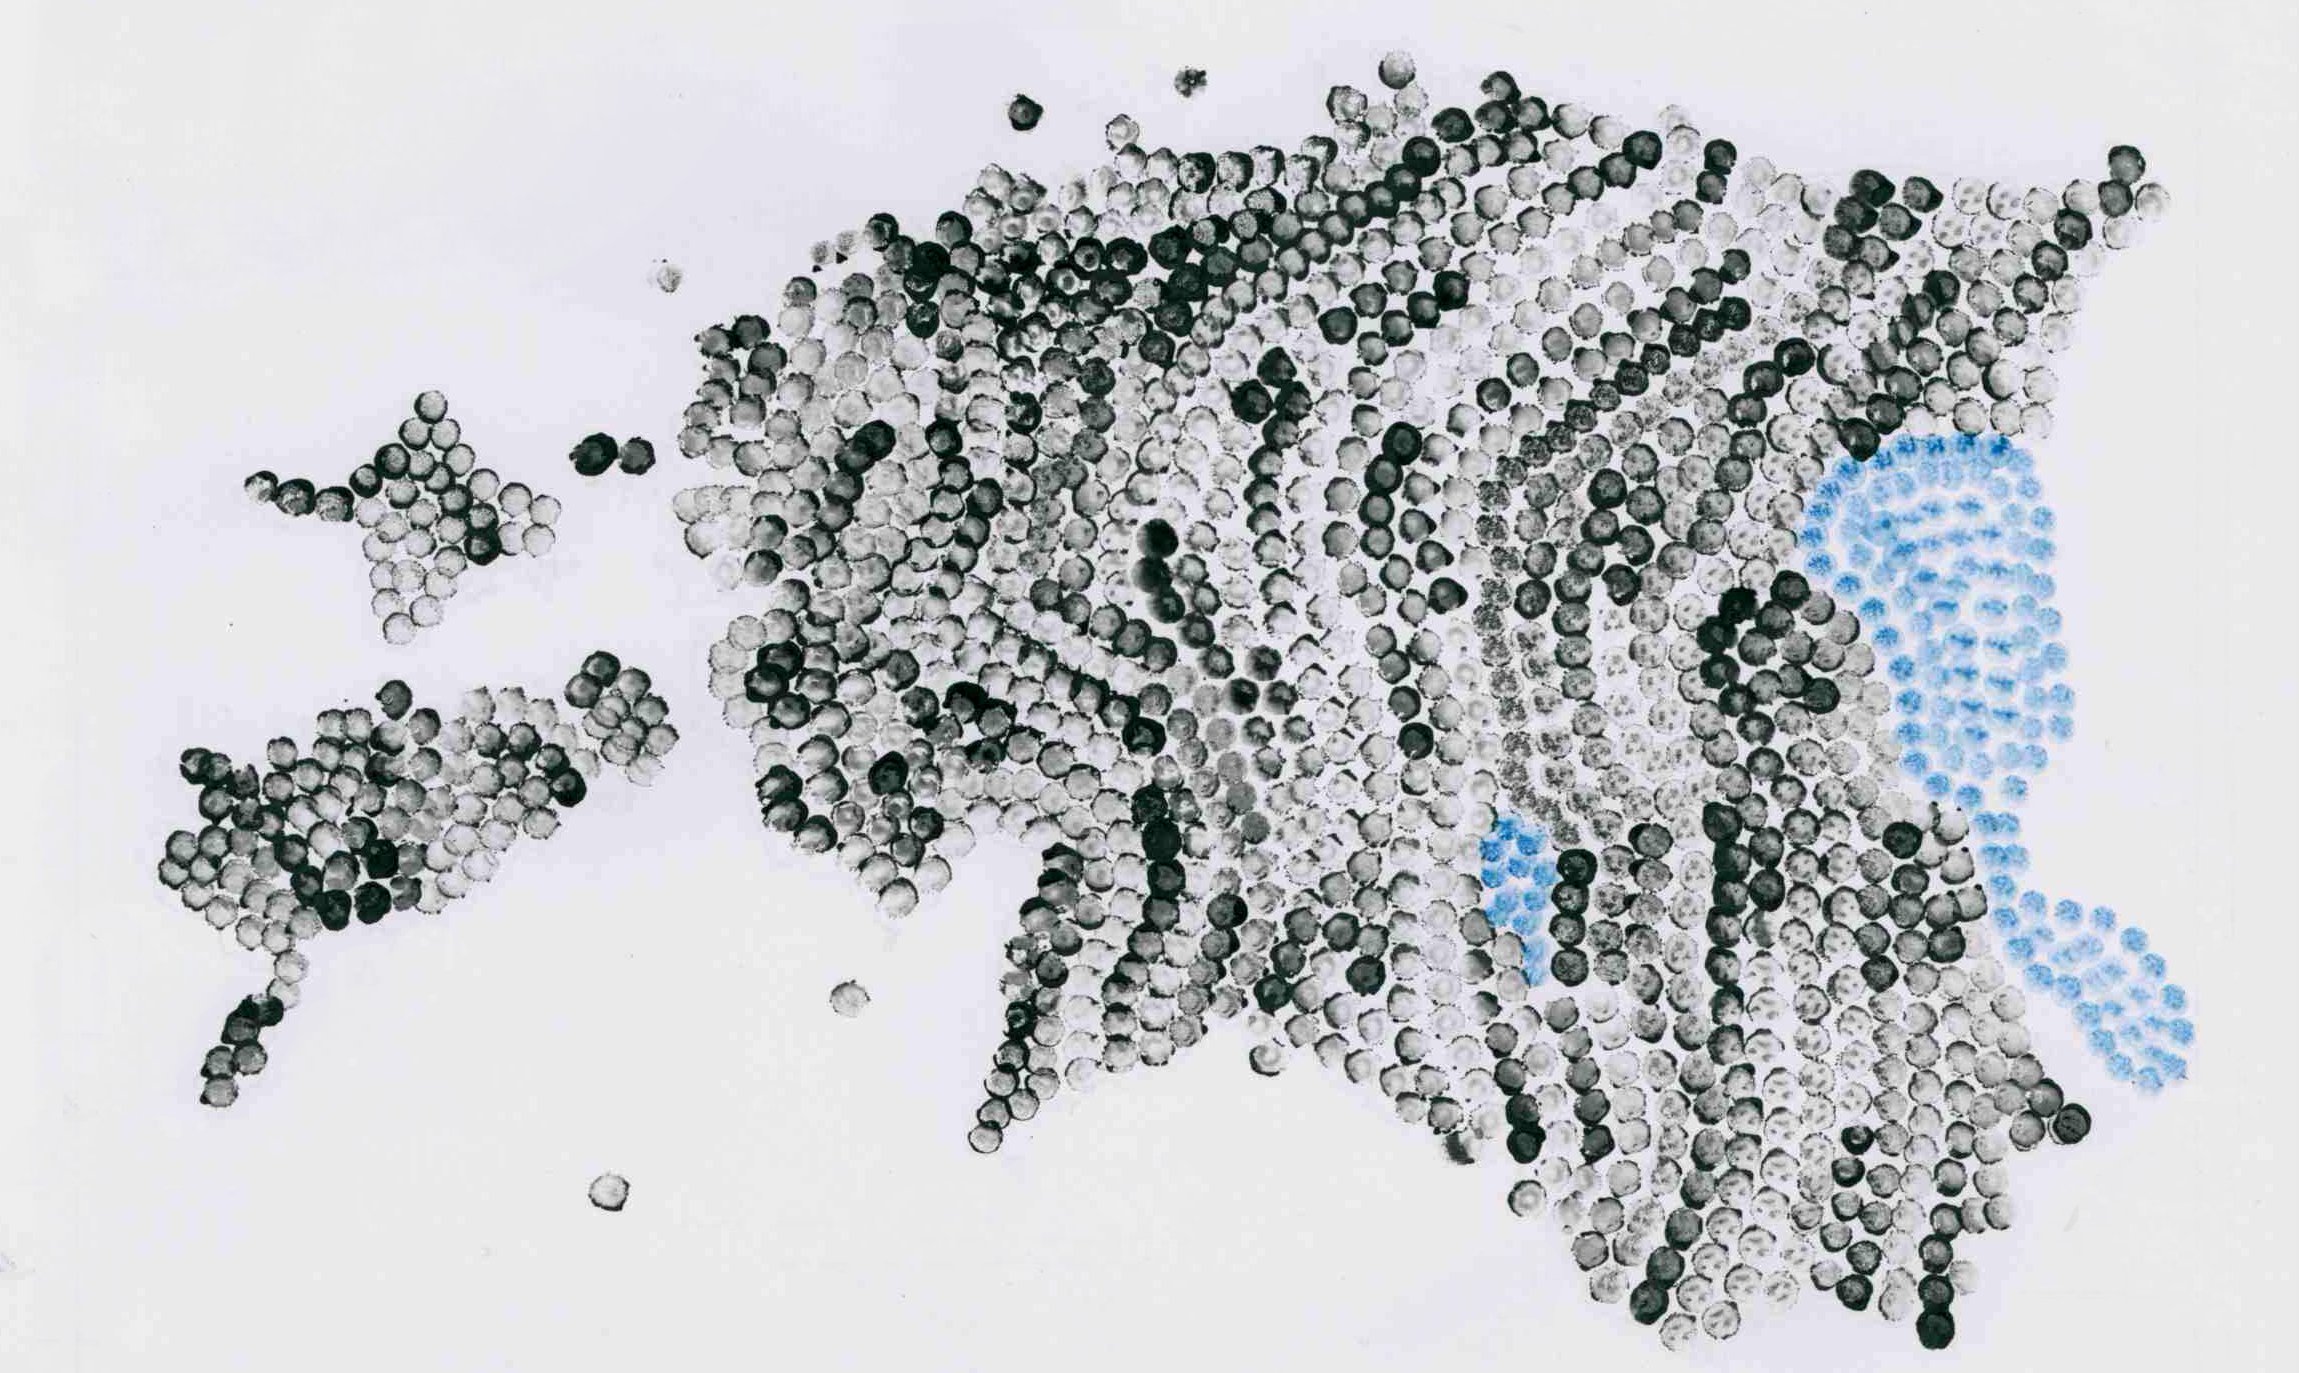
Painted Estonia
Map by Evelyn Uuemaa.
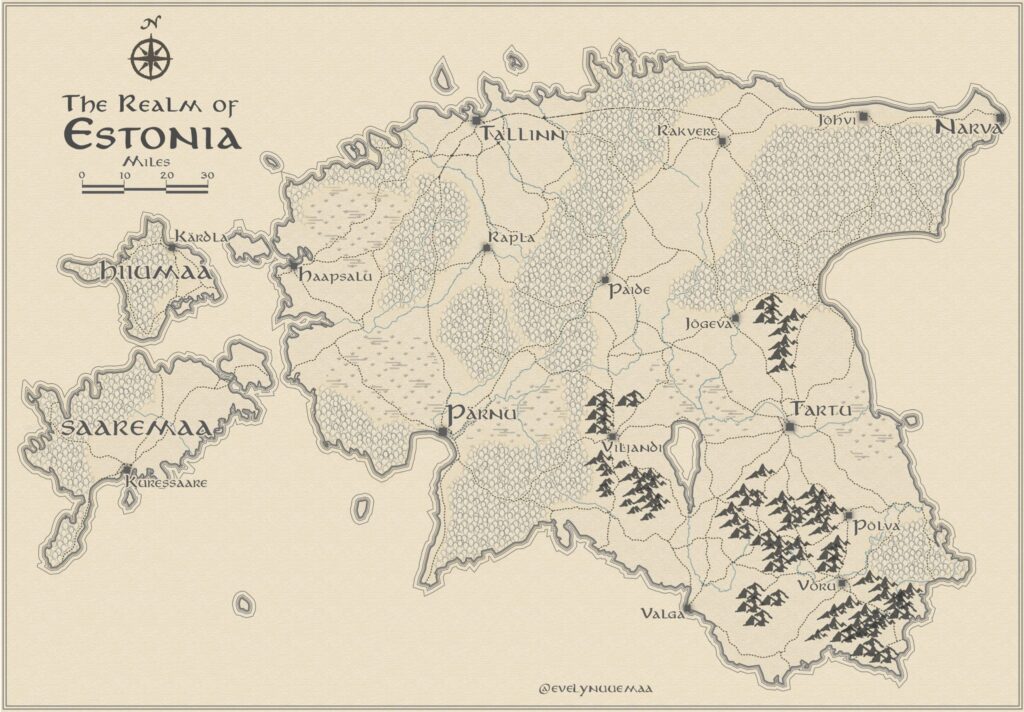
Estonia in the style of ‘Lord of the Rings’
Estonia in the style of ‘Lord of the Rings’ looks historical, but it’s a fantasy. Map by Evelyn Uuemaa.
Cover: Estonia in the style of ‘Lord of the Rings’ looks historical, but it’s a fantasy. Map by Evelyn Uuemaa.
Estonian World is a global independent online magazine, founded in London in 2012 and headquartered in Tallinn, Estonia. The magazine has editorial representations in London, Boston, Los Angeles and Tallinn, and contributors all over the world, on every continent. Follow us on Facebook, Twitter, LinkedIn and Instagram.